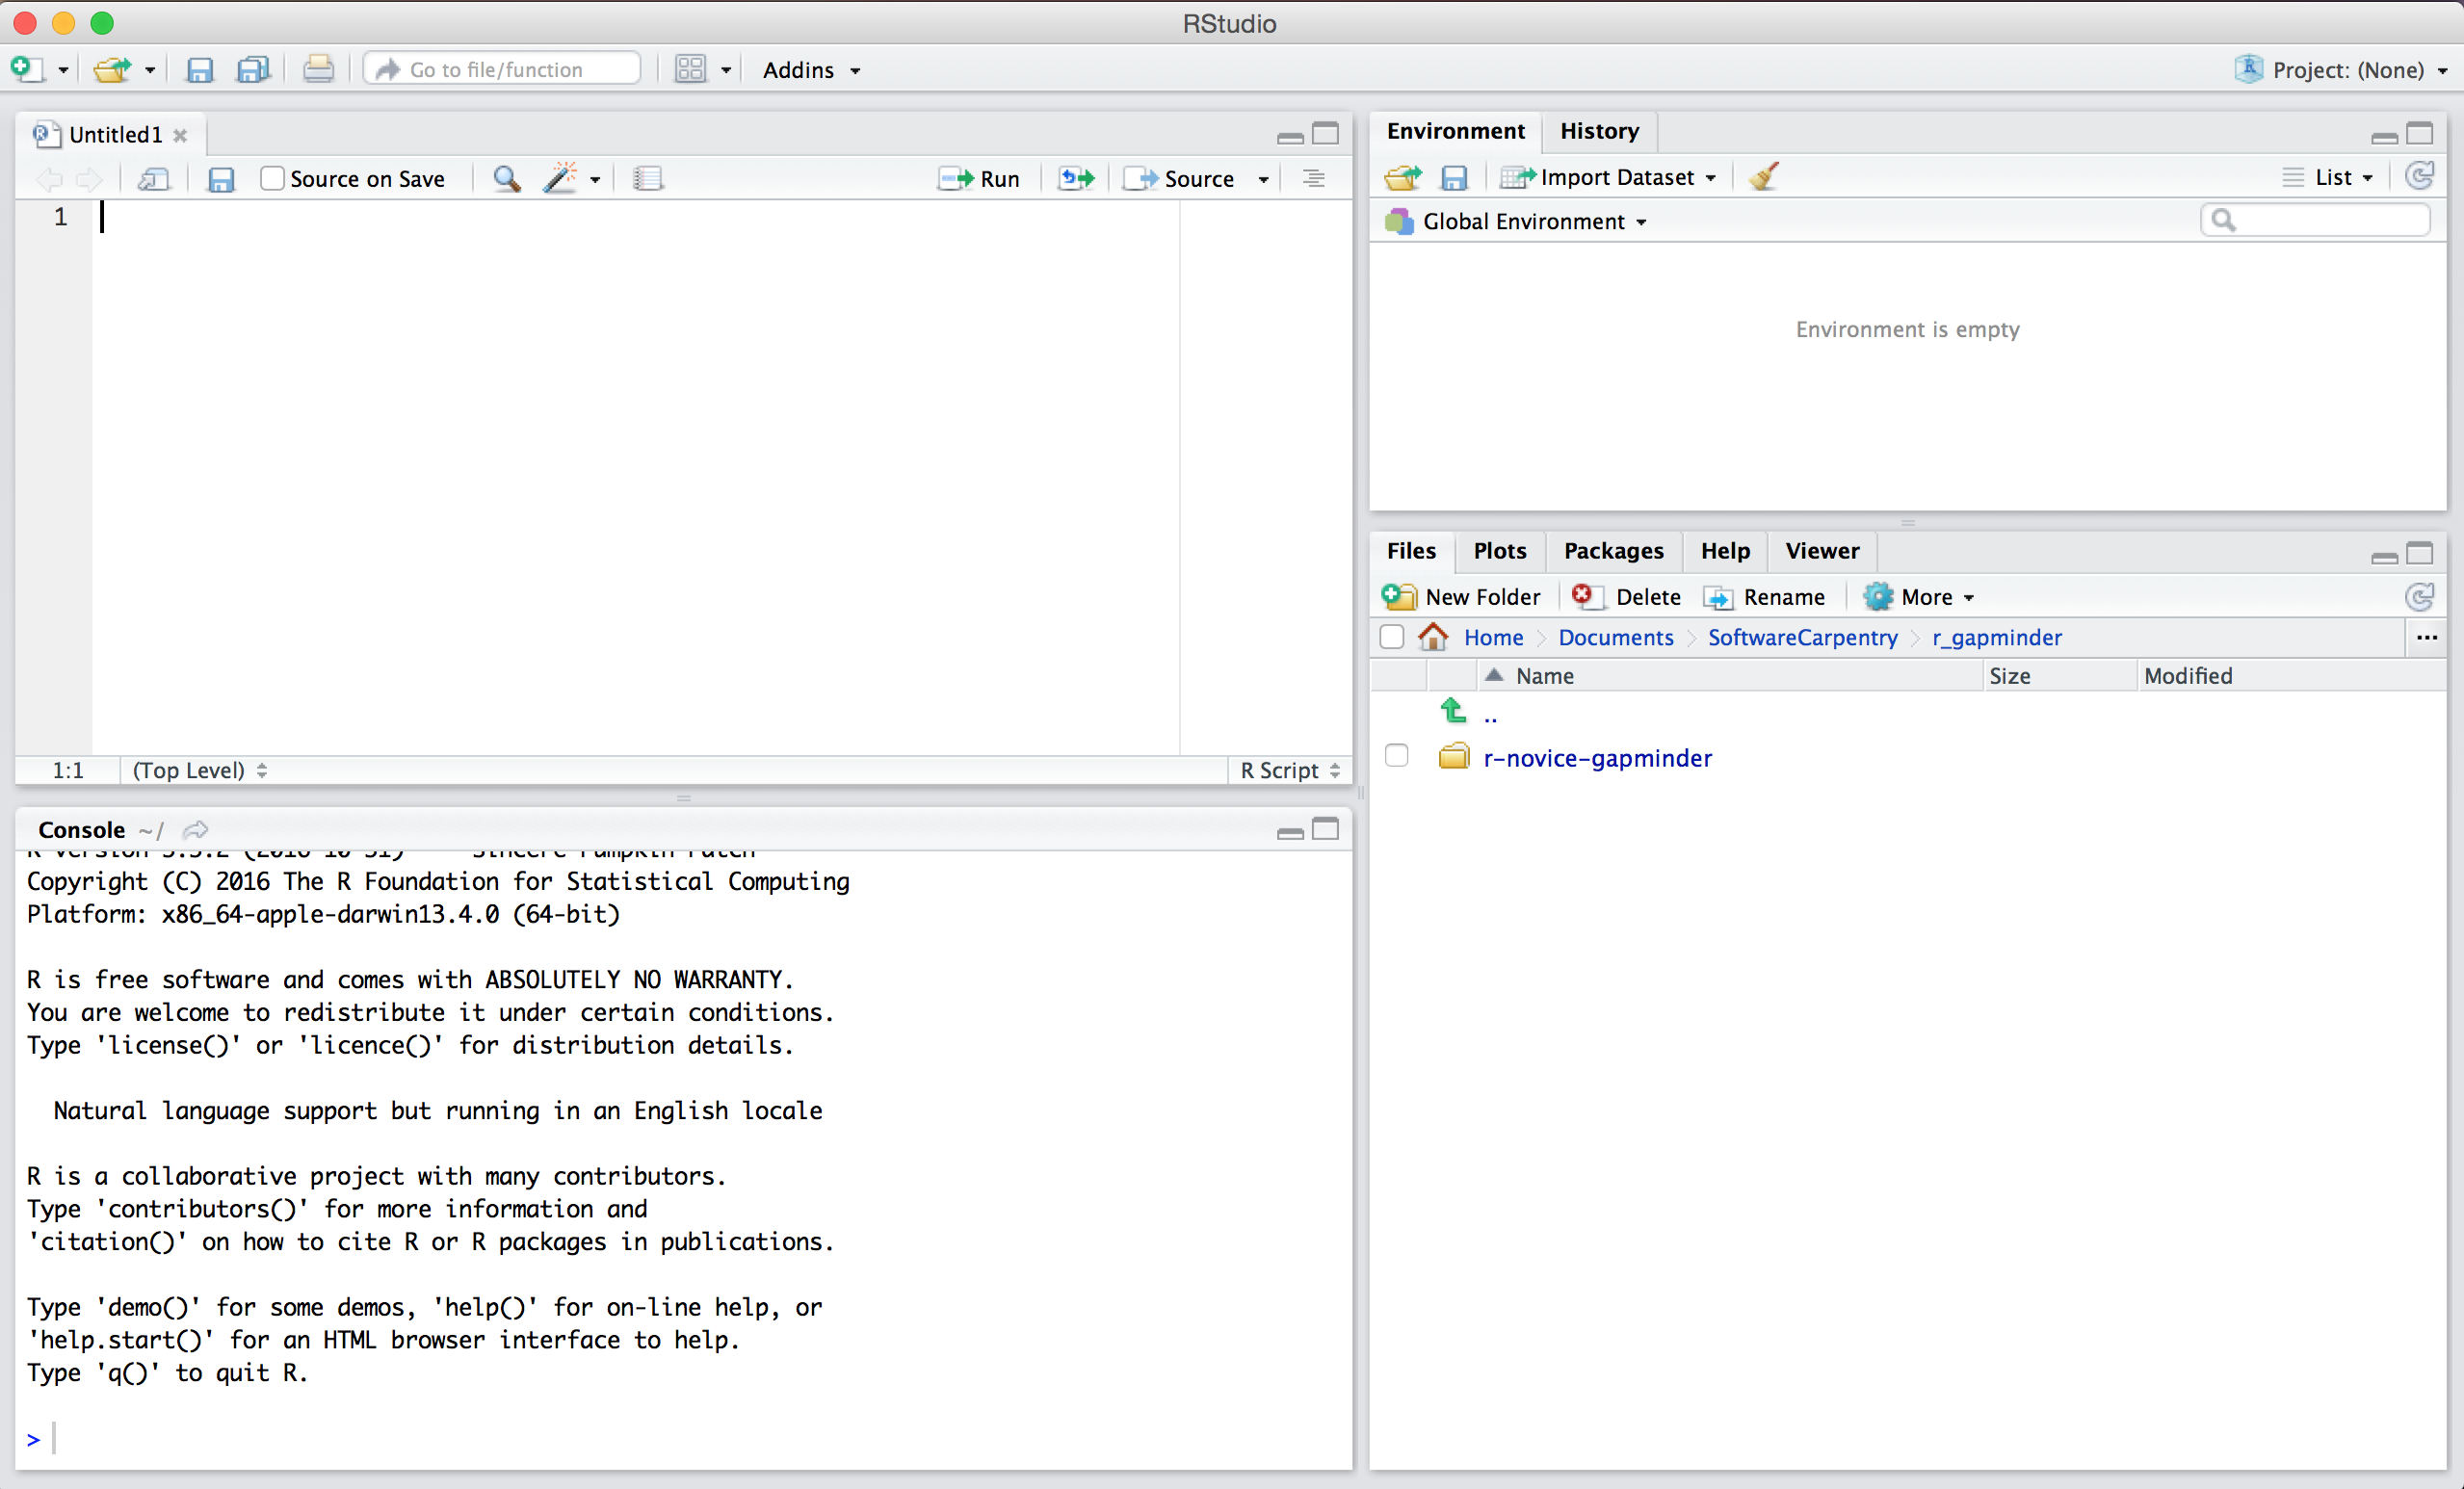
Introduction to R and RStudio
Figure 1
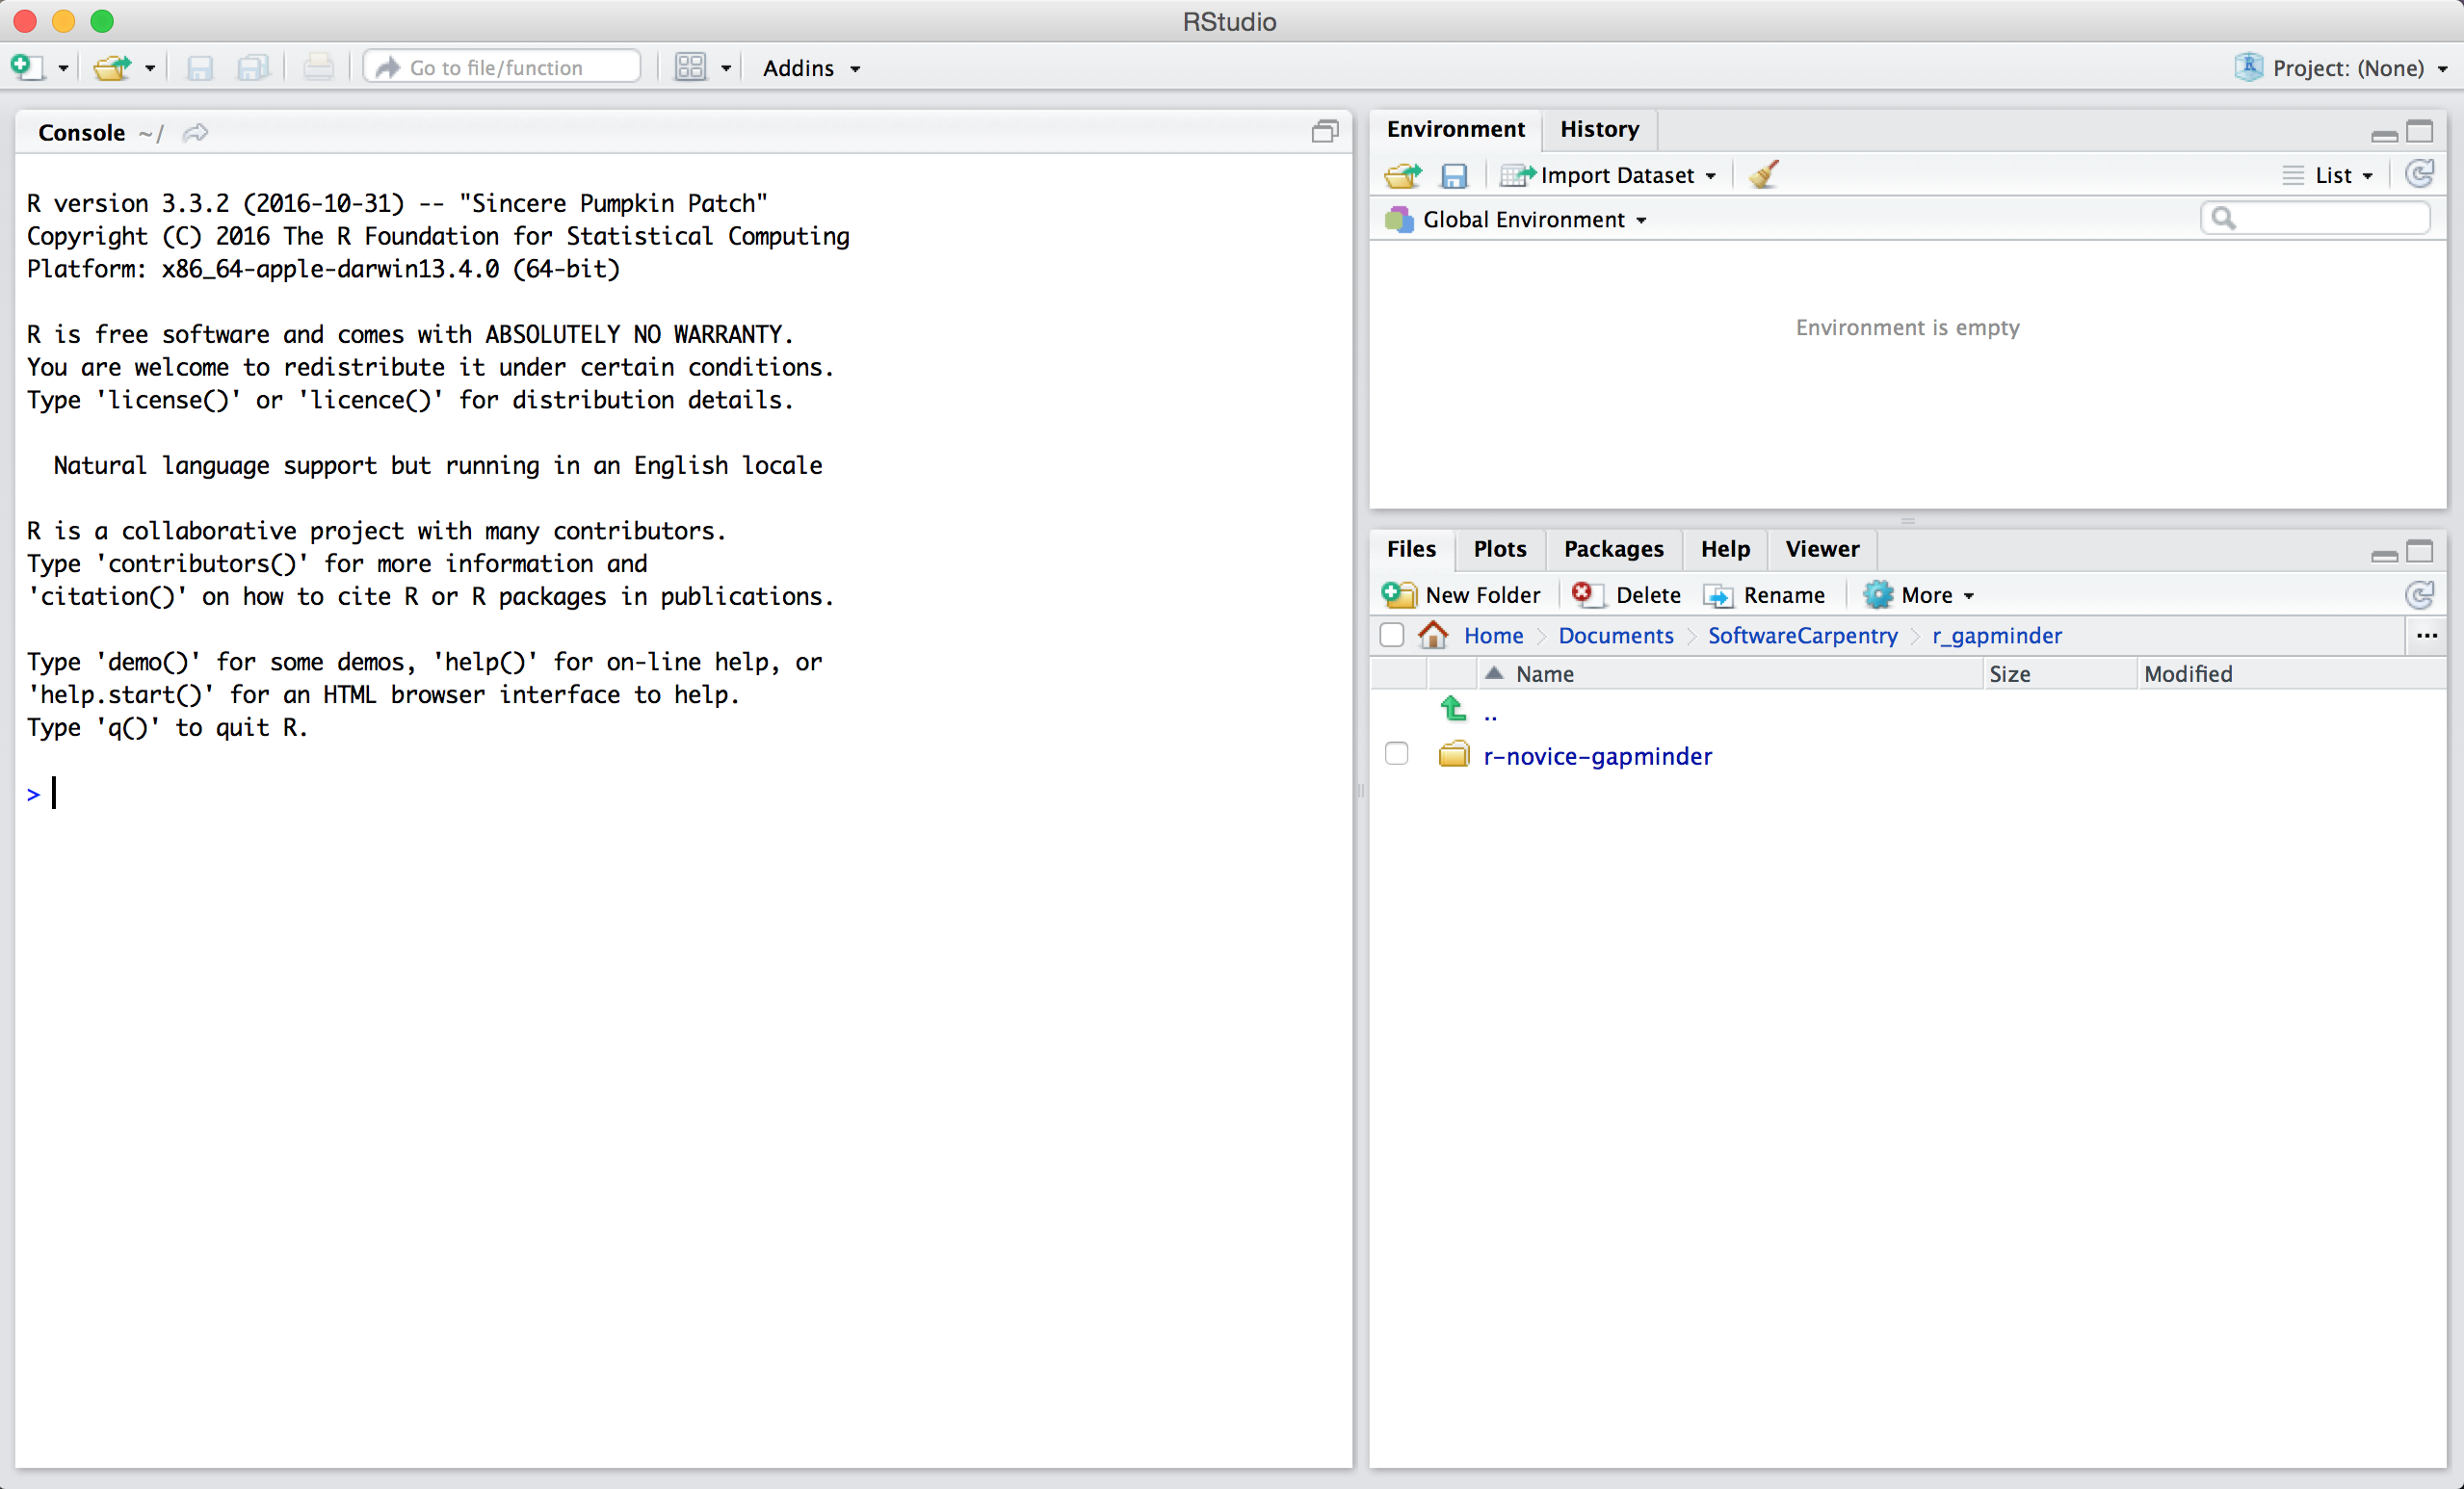
Figure 2
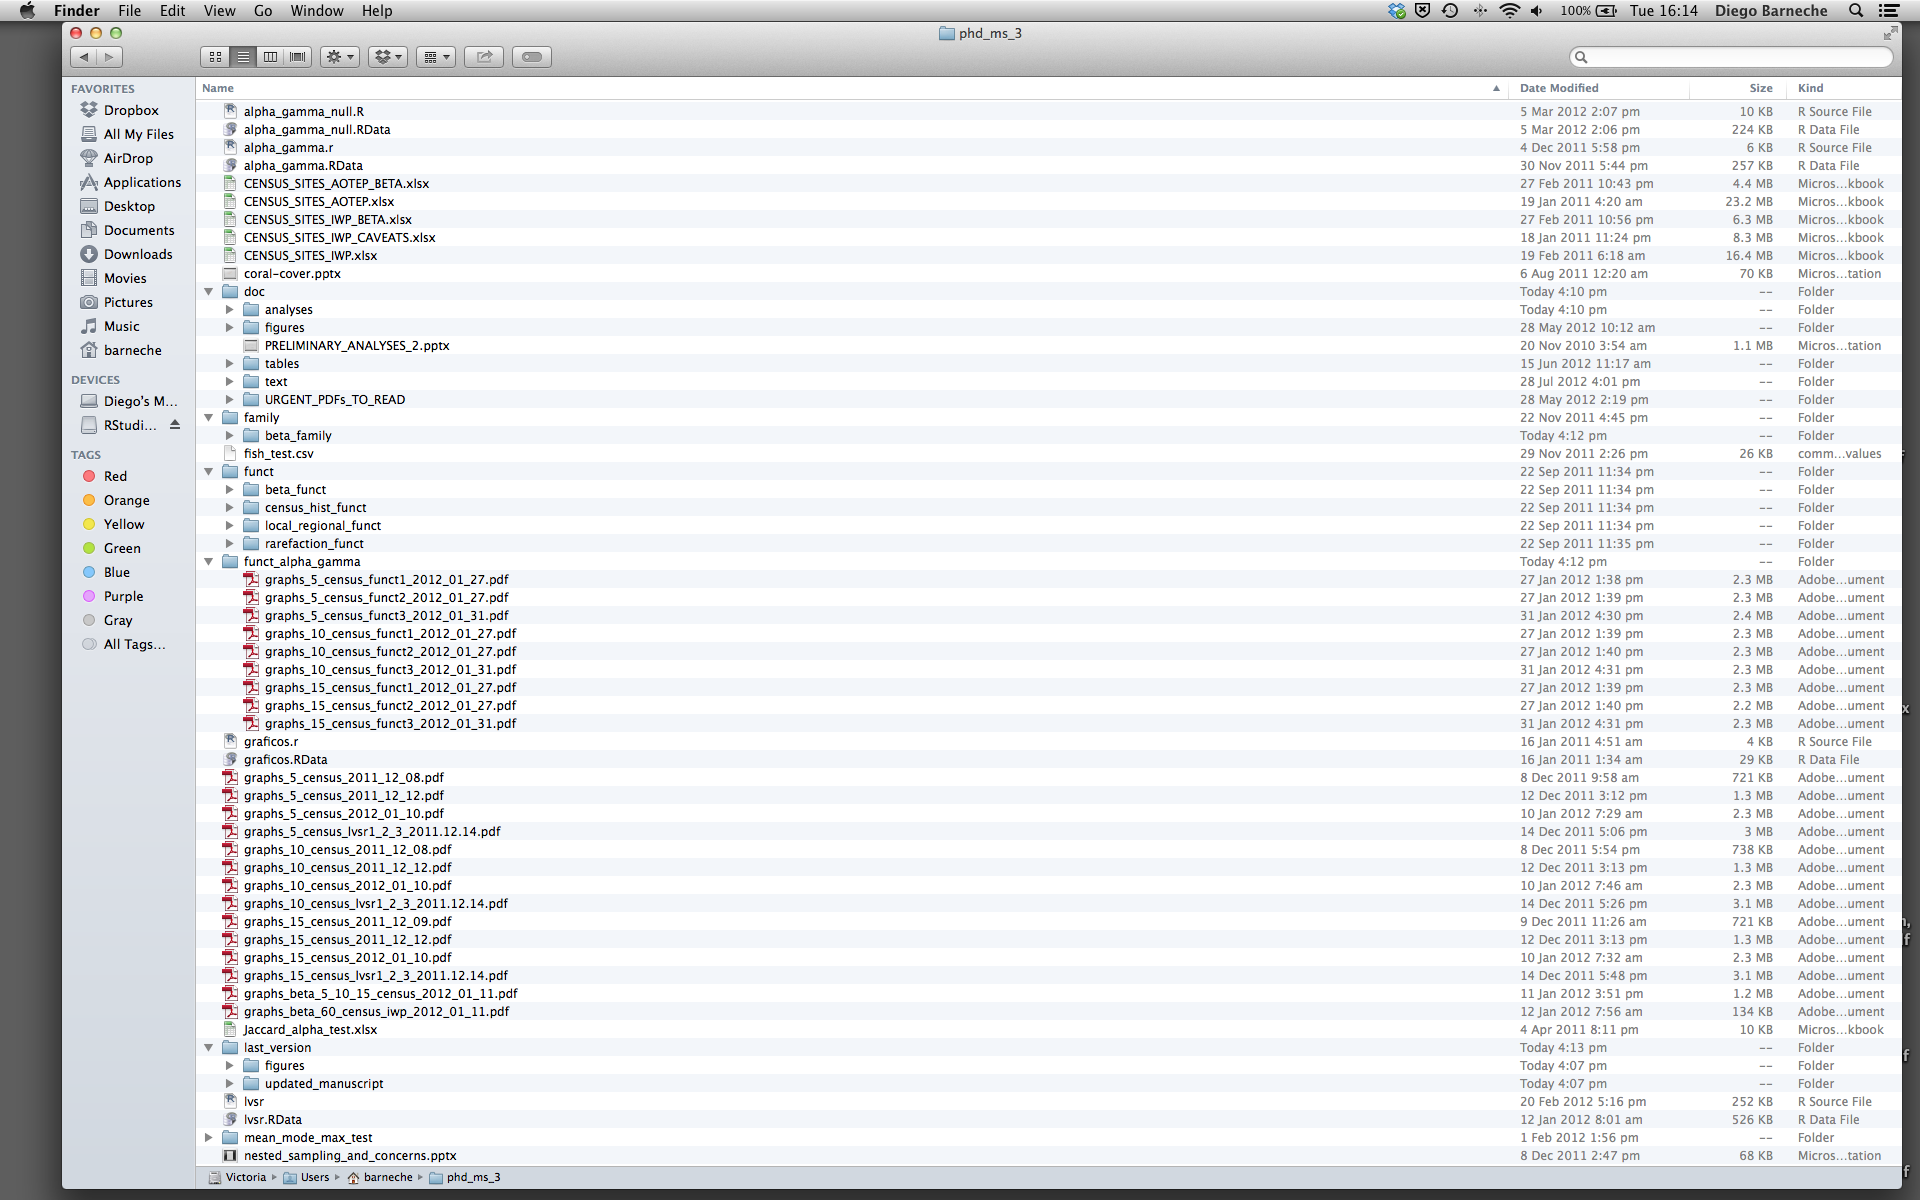
Project Management With RStudio
Figure 1
Data Structures
Subsetting Data
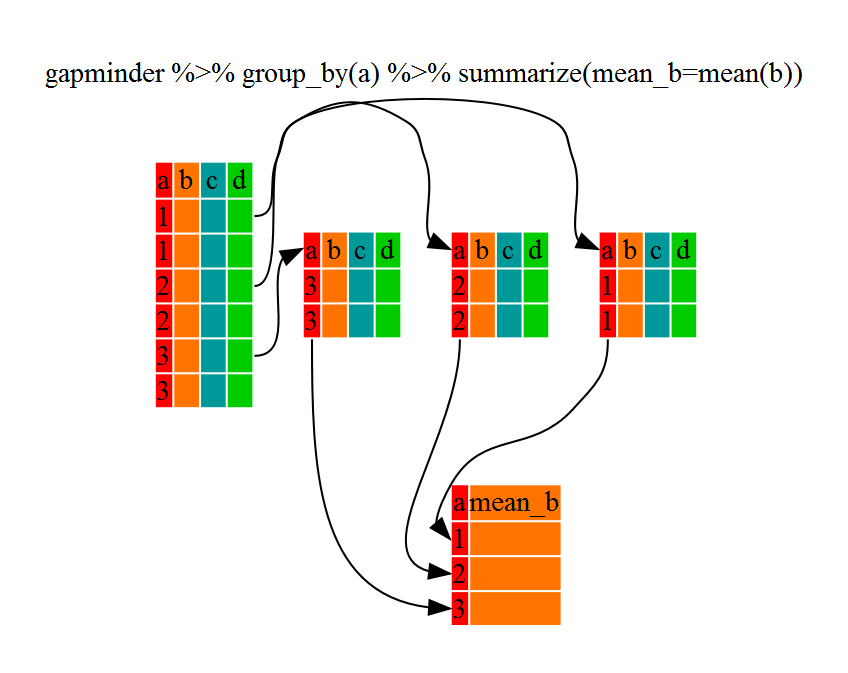
Data frame Manipulation with dplyr
Figure 1
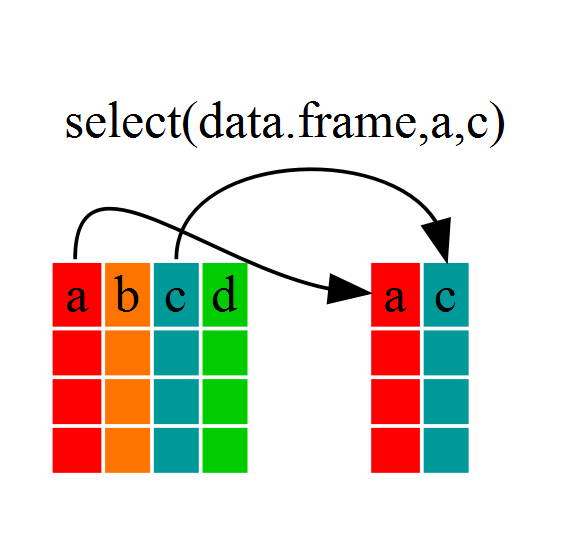
Figure 2
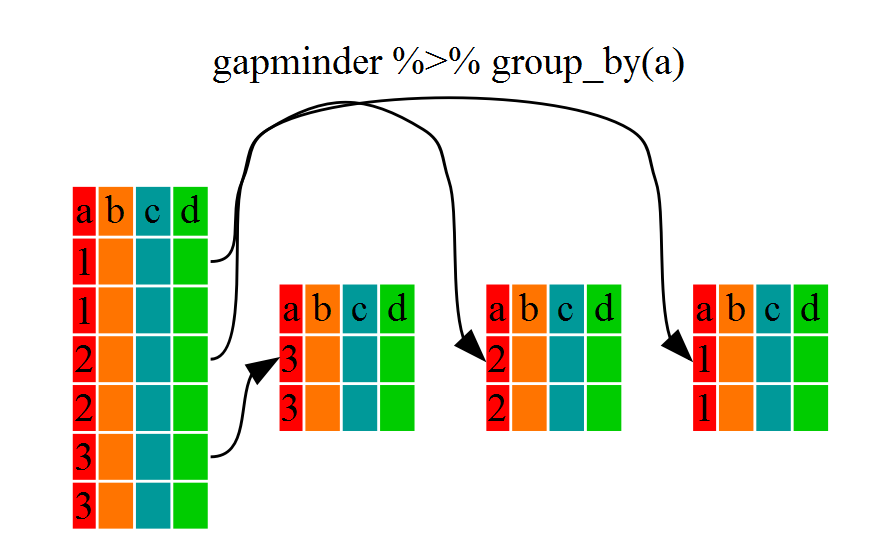
Figure 3
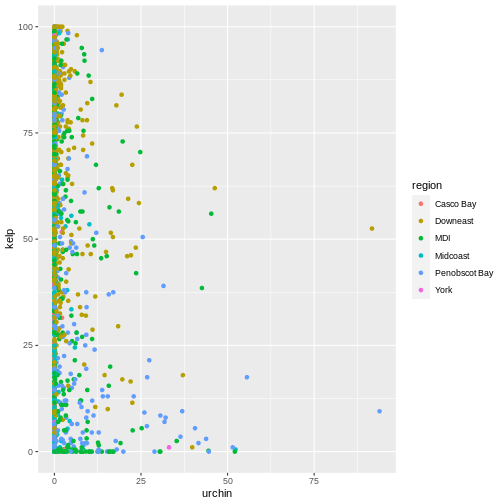
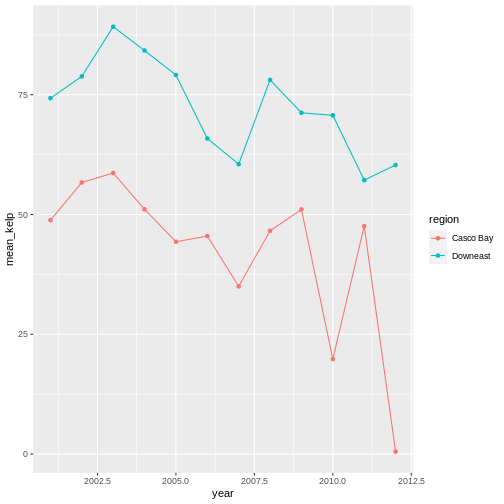
Introduction to Visualization
Figure 1

Figure 2
Figure 3
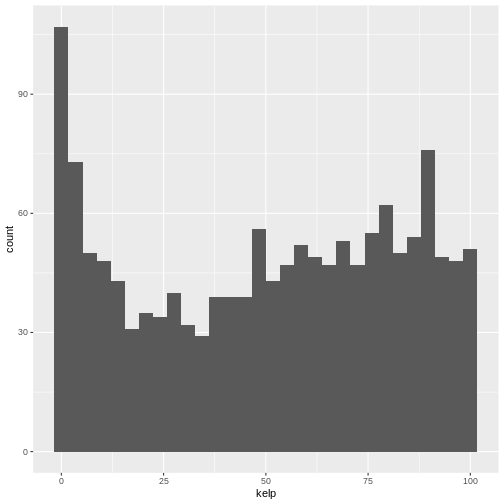
Figure 4
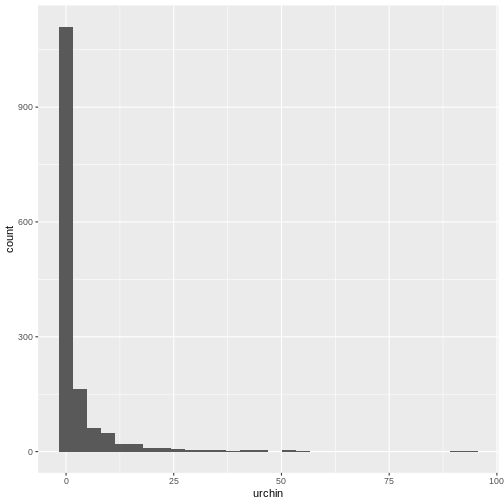
Figure 5
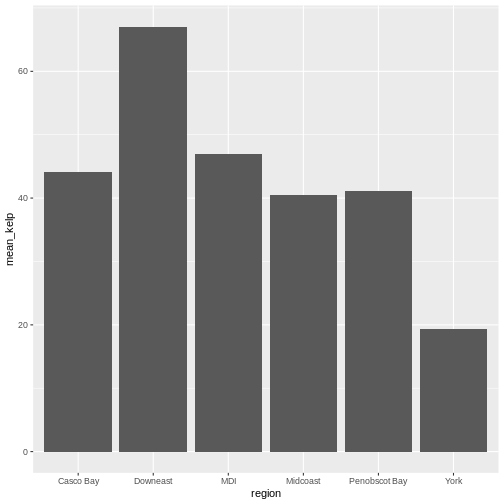
Figure 6
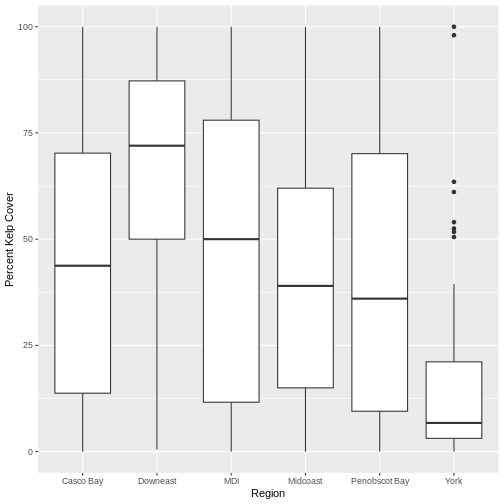
Figure 7
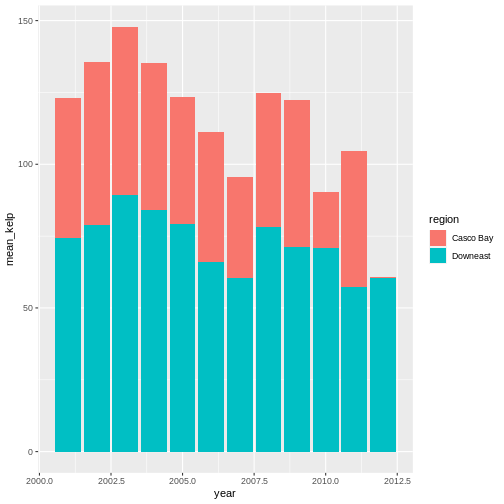
Figure 8
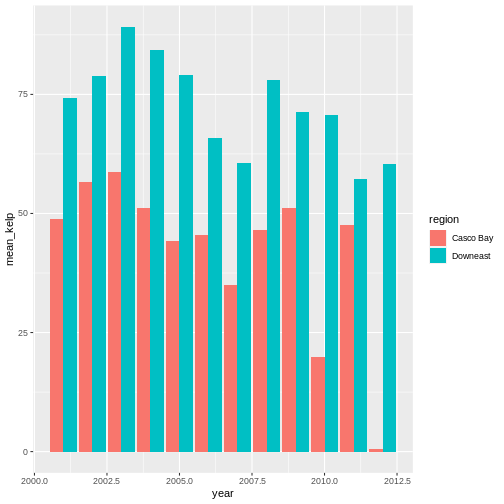
Figure 9
Writing Data
Figure 1