Inputs and Outputs
Last updated on 2024-02-20 | Edit this page
ERROR
Error: package or namespace load failed for 'units' in dyn.load(file, DLLpath = DLLpath, ...):
 unable to load shared object '/home/runner/.local/share/renv/cache/v5/R-4.3/x86_64-pc-linux-gnu/units/0.8-5/119d19da480e873f72241ff6962ffd83/units/libs/units.so':
  libudunits2.so.0: cannot open shared object file: No such file or directory
ERROR
Error: package or namespace load failed for 'sf' in dyn.load(file, DLLpath = DLLpath, ...):
 unable to load shared object '/home/runner/.local/share/renv/cache/v5/R-4.3/x86_64-pc-linux-gnu/units/0.8-5/119d19da480e873f72241ff6962ffd83/units/libs/units.so':
  libudunits2.so.0: cannot open shared object file: No such file or directory
Overview
Questions
- How do we let users query the data?
- How do we change the data to let the app respond to the user?
Objectives
- Show how to add inputs and spaces for outputs to an app UI.
- Demonstrate server logic to create custom reactive outputs.
Adding Data to Our App Thus Far
So far, we have created an app with a basic layout
R
# 1. Preamble
library(shiny)
library(shinythemes)

# 2. Define a User Interface
ui <- fluidPage(
  title = "Seagrass in Casco App",
  theme = shinytheme("sandstone"),

 titlePanel("Seagrass in Casco Bay over time"),

 sidebarLayout(
   sidebarPanel("This is the sidebar"),
   mainPanel("This is the main panel")
 )
)

# 3. define a server
server <- function(input, output) {}

# 4. Call shinyApp() to run your app
shinyApp(ui = ui, server = server)
We don’t create apps to be static and bare, however. We want this app
to explore data from Maine
DEP surveys of Seagrass Beds through time. To make this easier, here
we provide a saved sf object that is merged seagrass data
through time. Note, this is not a raw shapefile, but rather the result
of some post-processing of the data layers provided by the Maine
GeoLibrary.
You
can download the data here. Note how small .Rds files
are. This was generated with saveRds() which can save out
any R object.
Challenge
To the preamble of your all, load the
sfpackage, thedplyrpackage, and load the data usingreadRDS(). It works just likemy_dat <- read.csv("data/my_data.csv). Let’s call this dataseagrass_casco.Explore the data a bit. What are the columns? What is the projection? What years are here? How many beds are there per year? What are the potential percent cover classes?
R
library(sf)
ERROR
Error: package or namespace load failed for 'sf' in dyn.load(file, DLLpath = DLLpath, ...):
 unable to load shared object '/home/runner/.local/share/renv/cache/v5/R-4.3/x86_64-pc-linux-gnu/units/0.8-5/119d19da480e873f72241ff6962ffd83/units/libs/units.so':
  libudunits2.so.0: cannot open shared object file: No such file or directory
R
library(dplyr)

seagrass_casco <- readRDS("data/joined_seagrass_cover.Rds")
R
#what is here
str(seagrass_casco)
OUTPUT
Classes 'sf' and 'data.frame':	4946 obs. of  7 variables:
 $ year     : num  2022 2022 2022 2022 2022 ...
 $ acres    : num  0.0446 0.0608 2.5622 0.7182 0.0182 ...
 $ hectares : num  0.01803 0.02459 1.03688 0.29063 0.00735 ...
 $ cover    : int  1 3 3 3 3 3 1 1 3 4 ...
 $ cover_pct: chr  "0% to 10%" "40% to 70%" "40% to 70%" "40% to 70%" ...
 $ year97   : int  NA NA NA NA NA NA NA NA NA NA ...
 $ geometry :List of 4946
  ..$ :List of 1
  .. ..$ : num [1:55, 1:2] -70.2 -70.2 -70.2 -70.2 -70.2 ...
  .. ..- attr(*, "class")= chr [1:3] "XY" "POLYGON" "sfg"
  ..$ :List of 1
  .. ..$ : num [1:39, 1:2] -70.2 -70.2 -70.2 -70.2 -70.2 ...
  .. ..- attr(*, "class")= chr [1:3] "XY" "POLYGON" "sfg"
  ..$ :List of 1
  .. ..$ : num [1:145, 1:2] -70.2 -70.2 -70.2 -70.2 -70.2 ...
  .. ..- attr(*, "class")= chr [1:3] "XY" "POLYGON" "sfg"
  ..$ :List of 1
  .. ..$ : num [1:68, 1:2] -70.2 -70.2 -70.2 -70.2 -70.2 ...
  .. ..- attr(*, "class")= chr [1:3] "XY" "POLYGON" "sfg"
  ..$ :List of 1
  .. ..$ : num [1:18, 1:2] -70.2 -70.2 -70.2 -70.2 -70.2 ...
  .. ..- attr(*, "class")= chr [1:3] "XY" "POLYGON" "sfg"
  ..$ :List of 1
  .. ..$ : num [1:38, 1:2] -70.2 -70.2 -70.2 -70.2 -70.2 ...
  .. ..- attr(*, "class")= chr [1:3] "XY" "POLYGON" "sfg"
  ..$ :List of 1
  .. ..$ : num [1:37, 1:2] -70.2 -70.2 -70.2 -70.2 -70.2 ...
  .. ..- attr(*, "class")= chr [1:3] "XY" "POLYGON" "sfg"
  ..$ :List of 1
  .. ..$ : num [1:60, 1:2] -70.2 -70.2 -70.2 -70.2 -70.2 ...
  .. ..- attr(*, "class")= chr [1:3] "XY" "POLYGON" "sfg"
  ..$ :List of 1
  .. ..$ : num [1:21, 1:2] -70.2 -70.2 -70.2 -70.2 -70.2 ...
  .. ..- attr(*, "class")= chr [1:3] "XY" "POLYGON" "sfg"
  ..$ :List of 1
  .. ..$ : num [1:103, 1:2] -70.2 -70.2 -70.2 -70.2 -70.2 ...
  .. ..- attr(*, "class")= chr [1:3] "XY" "POLYGON" "sfg"
  ..$ :List of 1
  .. ..$ : num [1:48, 1:2] -70.2 -70.2 -70.2 -70.2 -70.2 ...
  .. ..- attr(*, "class")= chr [1:3] "XY" "POLYGON" "sfg"
  ..$ :List of 1
  .. ..$ : num [1:32, 1:2] -70.2 -70.2 -70.2 -70.2 -70.2 ...
  .. ..- attr(*, "class")= chr [1:3] "XY" "POLYGON" "sfg"
  ..$ :List of 1
  .. ..$ : num [1:64, 1:2] -70.2 -70.2 -70.2 -70.2 -70.2 ...
  .. ..- attr(*, "class")= chr [1:3] "XY" "POLYGON" "sfg"
  ..$ :List of 1
  .. ..$ : num [1:78, 1:2] -70.2 -70.2 -70.2 -70.2 -70.2 ...
  .. ..- attr(*, "class")= chr [1:3] "XY" "POLYGON" "sfg"
  ..$ :List of 1
  .. ..$ : num [1:47, 1:2] -70.2 -70.2 -70.2 -70.2 -70.2 ...
  .. ..- attr(*, "class")= chr [1:3] "XY" "POLYGON" "sfg"
  ..$ :List of 1
  .. ..$ : num [1:29, 1:2] -70.2 -70.2 -70.2 -70.2 -70.2 ...
  .. ..- attr(*, "class")= chr [1:3] "XY" "POLYGON" "sfg"
  ..$ :List of 1
  .. ..$ : num [1:54, 1:2] -70.2 -70.2 -70.2 -70.2 -70.2 ...
  .. ..- attr(*, "class")= chr [1:3] "XY" "POLYGON" "sfg"
  ..$ :List of 1
  .. ..$ : num [1:22, 1:2] -70.2 -70.2 -70.2 -70.2 -70.2 ...
  .. ..- attr(*, "class")= chr [1:3] "XY" "POLYGON" "sfg"
  ..$ :List of 1
  .. ..$ : num [1:36, 1:2] -70.2 -70.2 -70.2 -70.2 -70.2 ...
  .. ..- attr(*, "class")= chr [1:3] "XY" "POLYGON" "sfg"
  ..$ :List of 1
  .. ..$ : num [1:258, 1:2] -70.2 -70.2 -70.2 -70.2 -70.2 ...
  .. ..- attr(*, "class")= chr [1:3] "XY" "POLYGON" "sfg"
  ..$ :List of 1
  .. ..$ : num [1:29, 1:2] -70.2 -70.2 -70.2 -70.2 -70.2 ...
  .. ..- attr(*, "class")= chr [1:3] "XY" "POLYGON" "sfg"
  ..$ :List of 1
  .. ..$ : num [1:11, 1:2] -70.2 -70.2 -70.2 -70.2 -70.2 ...
  .. ..- attr(*, "class")= chr [1:3] "XY" "POLYGON" "sfg"
  ..$ :List of 1
  .. ..$ : num [1:22, 1:2] -70.2 -70.2 -70.2 -70.2 -70.2 ...
  .. ..- attr(*, "class")= chr [1:3] "XY" "POLYGON" "sfg"
  ..$ :List of 1
  .. ..$ : num [1:11, 1:2] -70.2 -70.2 -70.2 -70.2 -70.2 ...
  .. ..- attr(*, "class")= chr [1:3] "XY" "POLYGON" "sfg"
  ..$ :List of 1
  .. ..$ : num [1:28, 1:2] -70.2 -70.2 -70.2 -70.2 -70.2 ...
  .. ..- attr(*, "class")= chr [1:3] "XY" "POLYGON" "sfg"
  ..$ :List of 1
  .. ..$ : num [1:431, 1:2] -70.2 -70.2 -70.2 -70.2 -70.2 ...
  .. ..- attr(*, "class")= chr [1:3] "XY" "POLYGON" "sfg"
  ..$ :List of 1
  .. ..$ : num [1:116, 1:2] -70.2 -70.2 -70.2 -70.2 -70.2 ...
  .. ..- attr(*, "class")= chr [1:3] "XY" "POLYGON" "sfg"
  ..$ :List of 1
  .. ..$ : num [1:203, 1:2] -70.2 -70.2 -70.2 -70.2 -70.2 ...
  .. ..- attr(*, "class")= chr [1:3] "XY" "POLYGON" "sfg"
  ..$ :List of 1
  .. ..$ : num [1:47, 1:2] -70.2 -70.2 -70.2 -70.2 -70.2 ...
  .. ..- attr(*, "class")= chr [1:3] "XY" "POLYGON" "sfg"
  ..$ :List of 1
  .. ..$ : num [1:358, 1:2] -70.2 -70.2 -70.2 -70.2 -70.2 ...
  .. ..- attr(*, "class")= chr [1:3] "XY" "POLYGON" "sfg"
  ..$ :List of 1
  .. ..$ : num [1:58, 1:2] -70.2 -70.2 -70.2 -70.2 -70.2 ...
  .. ..- attr(*, "class")= chr [1:3] "XY" "POLYGON" "sfg"
  ..$ :List of 1
  .. ..$ : num [1:186, 1:2] -70.2 -70.2 -70.2 -70.2 -70.2 ...
  .. ..- attr(*, "class")= chr [1:3] "XY" "POLYGON" "sfg"
  ..$ :List of 3
  .. ..$ : num [1:159, 1:2] -70.2 -70.2 -70.2 -70.2 -70.2 ...
  .. ..$ : num [1:23, 1:2] -70.2 -70.2 -70.2 -70.2 -70.2 ...
  .. ..$ : num [1:40, 1:2] -70.2 -70.2 -70.2 -70.2 -70.2 ...
  .. ..- attr(*, "class")= chr [1:3] "XY" "POLYGON" "sfg"
  ..$ :List of 3
  .. ..$ : num [1:184, 1:2] -70.2 -70.2 -70.2 -70.2 -70.2 ...
  .. ..$ : num [1:16, 1:2] -70.2 -70.2 -70.2 -70.2 -70.2 ...
  .. ..$ : num [1:11, 1:2] -70.2 -70.2 -70.2 -70.2 -70.2 ...
  .. ..- attr(*, "class")= chr [1:3] "XY" "POLYGON" "sfg"
  ..$ :List of 1
  .. ..$ : num [1:35, 1:2] -70.2 -70.2 -70.2 -70.2 -70.2 ...
  .. ..- attr(*, "class")= chr [1:3] "XY" "POLYGON" "sfg"
  ..$ :List of 1
  .. ..$ : num [1:141, 1:2] -70.2 -70.2 -70.2 -70.2 -70.2 ...
  .. ..- attr(*, "class")= chr [1:3] "XY" "POLYGON" "sfg"
  ..$ :List of 1
  .. ..$ : num [1:38, 1:2] -70.2 -70.2 -70.2 -70.2 -70.2 ...
  .. ..- attr(*, "class")= chr [1:3] "XY" "POLYGON" "sfg"
  ..$ :List of 1
  .. ..$ : num [1:68, 1:2] -70 -70 -70 -70 -70 ...
  .. ..- attr(*, "class")= chr [1:3] "XY" "POLYGON" "sfg"
  ..$ :List of 1
  .. ..$ : num [1:34, 1:2] -70 -70 -70 -70 -70 ...
  .. ..- attr(*, "class")= chr [1:3] "XY" "POLYGON" "sfg"
  ..$ :List of 1
  .. ..$ : num [1:51, 1:2] -70 -70 -70 -70 -70 ...
  .. ..- attr(*, "class")= chr [1:3] "XY" "POLYGON" "sfg"
  ..$ :List of 1
  .. ..$ : num [1:29, 1:2] -70 -70 -70 -70 -70 ...
  .. ..- attr(*, "class")= chr [1:3] "XY" "POLYGON" "sfg"
  ..$ :List of 1
  .. ..$ : num [1:29, 1:2] -70 -70 -70 -70 -70 ...
  .. ..- attr(*, "class")= chr [1:3] "XY" "POLYGON" "sfg"
  ..$ :List of 1
  .. ..$ : num [1:28, 1:2] -70 -70 -70 -70 -70 ...
  .. ..- attr(*, "class")= chr [1:3] "XY" "POLYGON" "sfg"
  ..$ :List of 1
  .. ..$ : num [1:57, 1:2] -70 -70 -70 -70 -70 ...
  .. ..- attr(*, "class")= chr [1:3] "XY" "POLYGON" "sfg"
  ..$ :List of 1
  .. ..$ : num [1:28, 1:2] -70 -70 -70 -70 -70 ...
  .. ..- attr(*, "class")= chr [1:3] "XY" "POLYGON" "sfg"
  ..$ :List of 1
  .. ..$ : num [1:36, 1:2] -70 -70 -70 -70 -70 ...
  .. ..- attr(*, "class")= chr [1:3] "XY" "POLYGON" "sfg"
  ..$ :List of 1
  .. ..$ : num [1:40, 1:2] -70.1 -70.1 -70.1 -70.1 -70.1 ...
  .. ..- attr(*, "class")= chr [1:3] "XY" "POLYGON" "sfg"
  ..$ :List of 1
  .. ..$ : num [1:39, 1:2] -70.1 -70.1 -70.1 -70.1 -70.1 ...
  .. ..- attr(*, "class")= chr [1:3] "XY" "POLYGON" "sfg"
  ..$ :List of 1
  .. ..$ : num [1:36, 1:2] -70.1 -70.1 -70.1 -70.1 -70.1 ...
  .. ..- attr(*, "class")= chr [1:3] "XY" "POLYGON" "sfg"
  ..$ :List of 2
  .. ..$ : num [1:82, 1:2] -70.1 -70.1 -70.1 -70.1 -70.1 ...
  .. ..$ : num [1:46, 1:2] -70.1 -70.1 -70.1 -70.1 -70.1 ...
  .. ..- attr(*, "class")= chr [1:3] "XY" "POLYGON" "sfg"
  ..$ :List of 1
  .. ..$ : num [1:26, 1:2] -70.1 -70.1 -70.1 -70.1 -70.1 ...
  .. ..- attr(*, "class")= chr [1:3] "XY" "POLYGON" "sfg"
  ..$ :List of 1
  .. ..$ : num [1:19, 1:2] -70.1 -70.1 -70.1 -70.1 -70.1 ...
  .. ..- attr(*, "class")= chr [1:3] "XY" "POLYGON" "sfg"
  ..$ :List of 1
  .. ..$ : num [1:36, 1:2] -70.1 -70.1 -70.1 -70.1 -70.1 ...
  .. ..- attr(*, "class")= chr [1:3] "XY" "POLYGON" "sfg"
  ..$ :List of 1
  .. ..$ : num [1:56, 1:2] -70.1 -70.1 -70.1 -70.1 -70.1 ...
  .. ..- attr(*, "class")= chr [1:3] "XY" "POLYGON" "sfg"
  ..$ :List of 1
  .. ..$ : num [1:24, 1:2] -70.1 -70.1 -70.1 -70.1 -70.1 ...
  .. ..- attr(*, "class")= chr [1:3] "XY" "POLYGON" "sfg"
  ..$ :List of 1
  .. ..$ : num [1:91, 1:2] -70.1 -70.1 -70.1 -70.1 -70.1 ...
  .. ..- attr(*, "class")= chr [1:3] "XY" "POLYGON" "sfg"
  ..$ :List of 1
  .. ..$ : num [1:65, 1:2] -70.1 -70.1 -70.1 -70.1 -70.1 ...
  .. ..- attr(*, "class")= chr [1:3] "XY" "POLYGON" "sfg"
  ..$ :List of 1
  .. ..$ : num [1:24, 1:2] -70.1 -70.1 -70.1 -70.1 -70.1 ...
  .. ..- attr(*, "class")= chr [1:3] "XY" "POLYGON" "sfg"
  ..$ :List of 1
  .. ..$ : num [1:16, 1:2] -70.1 -70.1 -70.1 -70.1 -70.1 ...
  .. ..- attr(*, "class")= chr [1:3] "XY" "POLYGON" "sfg"
  ..$ :List of 1
  .. ..$ : num [1:71, 1:2] -70.1 -70.1 -70.1 -70.1 -70.1 ...
  .. ..- attr(*, "class")= chr [1:3] "XY" "POLYGON" "sfg"
  ..$ :List of 1
  .. ..$ : num [1:76, 1:2] -70.1 -70.1 -70.1 -70.1 -70.1 ...
  .. ..- attr(*, "class")= chr [1:3] "XY" "POLYGON" "sfg"
  ..$ :List of 1
  .. ..$ : num [1:67, 1:2] -70.1 -70.1 -70.1 -70.1 -70.1 ...
  .. ..- attr(*, "class")= chr [1:3] "XY" "POLYGON" "sfg"
  ..$ :List of 1
  .. ..$ : num [1:97, 1:2] -70.1 -70.1 -70.1 -70.1 -70.1 ...
  .. ..- attr(*, "class")= chr [1:3] "XY" "POLYGON" "sfg"
  ..$ :List of 1
  .. ..$ : num [1:40, 1:2] -70.1 -70.1 -70.1 -70.1 -70.1 ...
  .. ..- attr(*, "class")= chr [1:3] "XY" "POLYGON" "sfg"
  ..$ :List of 1
  .. ..$ : num [1:142, 1:2] -70.1 -70.1 -70.1 -70.1 -70.1 ...
  .. ..- attr(*, "class")= chr [1:3] "XY" "POLYGON" "sfg"
  ..$ :List of 1
  .. ..$ : num [1:29, 1:2] -70.1 -70.1 -70.1 -70.1 -70.1 ...
  .. ..- attr(*, "class")= chr [1:3] "XY" "POLYGON" "sfg"
  ..$ :List of 1
  .. ..$ : num [1:35, 1:2] -70.2 -70.2 -70.2 -70.2 -70.2 ...
  .. ..- attr(*, "class")= chr [1:3] "XY" "POLYGON" "sfg"
  ..$ :List of 1
  .. ..$ : num [1:41, 1:2] -70.2 -70.2 -70.2 -70.2 -70.2 ...
  .. ..- attr(*, "class")= chr [1:3] "XY" "POLYGON" "sfg"
  ..$ :List of 1
  .. ..$ : num [1:54, 1:2] -70.2 -70.2 -70.2 -70.2 -70.2 ...
  .. ..- attr(*, "class")= chr [1:3] "XY" "POLYGON" "sfg"
  ..$ :List of 1
  .. ..$ : num [1:15, 1:2] -70.2 -70.2 -70.2 -70.2 -70.2 ...
  .. ..- attr(*, "class")= chr [1:3] "XY" "POLYGON" "sfg"
  ..$ :List of 1
  .. ..$ : num [1:44, 1:2] -70.2 -70.2 -70.2 -70.2 -70.2 ...
  .. ..- attr(*, "class")= chr [1:3] "XY" "POLYGON" "sfg"
  ..$ :List of 1
  .. ..$ : num [1:71, 1:2] -70.2 -70.2 -70.2 -70.2 -70.2 ...
  .. ..- attr(*, "class")= chr [1:3] "XY" "POLYGON" "sfg"
  ..$ :List of 1
  .. ..$ : num [1:40, 1:2] -70.2 -70.2 -70.2 -70.2 -70.2 ...
  .. ..- attr(*, "class")= chr [1:3] "XY" "POLYGON" "sfg"
  ..$ :List of 1
  .. ..$ : num [1:10, 1:2] -70.2 -70.2 -70.2 -70.2 -70.2 ...
  .. ..- attr(*, "class")= chr [1:3] "XY" "POLYGON" "sfg"
  ..$ :List of 1
  .. ..$ : num [1:31, 1:2] -70.2 -70.2 -70.2 -70.2 -70.2 ...
  .. ..- attr(*, "class")= chr [1:3] "XY" "POLYGON" "sfg"
  ..$ :List of 1
  .. ..$ : num [1:26, 1:2] -70.2 -70.2 -70.2 -70.2 -70.2 ...
  .. ..- attr(*, "class")= chr [1:3] "XY" "POLYGON" "sfg"
  ..$ :List of 1
  .. ..$ : num [1:38, 1:2] -70.2 -70.2 -70.2 -70.2 -70.2 ...
  .. ..- attr(*, "class")= chr [1:3] "XY" "POLYGON" "sfg"
  ..$ :List of 1
  .. ..$ : num [1:67, 1:2] -70.1 -70.1 -70.1 -70.1 -70.1 ...
  .. ..- attr(*, "class")= chr [1:3] "XY" "POLYGON" "sfg"
  ..$ :List of 1
  .. ..$ : num [1:73, 1:2] -70.1 -70.1 -70.1 -70.1 -70.1 ...
  .. ..- attr(*, "class")= chr [1:3] "XY" "POLYGON" "sfg"
  ..$ :List of 1
  .. ..$ : num [1:263, 1:2] -70.1 -70.1 -70.1 -70.1 -70.1 ...
  .. ..- attr(*, "class")= chr [1:3] "XY" "POLYGON" "sfg"
  ..$ :List of 1
  .. ..$ : num [1:21, 1:2] -70.2 -70.2 -70.2 -70.2 -70.2 ...
  .. ..- attr(*, "class")= chr [1:3] "XY" "POLYGON" "sfg"
  ..$ :List of 1
  .. ..$ : num [1:299, 1:2] -70.2 -70.2 -70.2 -70.2 -70.2 ...
  .. ..- attr(*, "class")= chr [1:3] "XY" "POLYGON" "sfg"
  ..$ :List of 1
  .. ..$ : num [1:50, 1:2] -70.2 -70.2 -70.2 -70.2 -70.2 ...
  .. ..- attr(*, "class")= chr [1:3] "XY" "POLYGON" "sfg"
  ..$ :List of 1
  .. ..$ : num [1:37, 1:2] -70.1 -70.1 -70.1 -70.1 -70.1 ...
  .. ..- attr(*, "class")= chr [1:3] "XY" "POLYGON" "sfg"
  ..$ :List of 1
  .. ..$ : num [1:31, 1:2] -70.2 -70.2 -70.2 -70.2 -70.2 ...
  .. ..- attr(*, "class")= chr [1:3] "XY" "POLYGON" "sfg"
  ..$ :List of 3
  .. ..$ : num [1:167, 1:2] -70.2 -70.2 -70.2 -70.2 -70.2 ...
  .. ..$ : num [1:12, 1:2] -70.2 -70.2 -70.2 -70.2 -70.2 ...
  .. ..$ : num [1:39, 1:2] -70.2 -70.2 -70.2 -70.2 -70.2 ...
  .. ..- attr(*, "class")= chr [1:3] "XY" "POLYGON" "sfg"
  ..$ :List of 1
  .. ..$ : num [1:30, 1:2] -70.2 -70.2 -70.2 -70.2 -70.2 ...
  .. ..- attr(*, "class")= chr [1:3] "XY" "POLYGON" "sfg"
  ..$ :List of 1
  .. ..$ : num [1:299, 1:2] -70.2 -70.2 -70.2 -70.2 -70.2 ...
  .. ..- attr(*, "class")= chr [1:3] "XY" "POLYGON" "sfg"
  ..$ :List of 1
  .. ..$ : num [1:59, 1:2] -70.2 -70.2 -70.2 -70.2 -70.2 ...
  .. ..- attr(*, "class")= chr [1:3] "XY" "POLYGON" "sfg"
  ..$ :List of 1
  .. ..$ : num [1:161, 1:2] -70.2 -70.2 -70.2 -70.2 -70.2 ...
  .. ..- attr(*, "class")= chr [1:3] "XY" "POLYGON" "sfg"
  ..$ :List of 1
  .. ..$ : num [1:147, 1:2] -70.2 -70.2 -70.2 -70.2 -70.2 ...
  .. ..- attr(*, "class")= chr [1:3] "XY" "POLYGON" "sfg"
  ..$ :List of 2
  .. ..$ : num [1:35, 1:2] -70.2 -70.2 -70.2 -70.2 -70.2 ...
  .. ..$ : num [1:22, 1:2] -70.2 -70.2 -70.2 -70.2 -70.2 ...
  .. ..- attr(*, "class")= chr [1:3] "XY" "POLYGON" "sfg"
  ..$ :List of 1
  .. ..$ : num [1:46, 1:2] -70.2 -70.2 -70.2 -70.2 -70.2 ...
  .. ..- attr(*, "class")= chr [1:3] "XY" "POLYGON" "sfg"
  ..$ :List of 1
  .. ..$ : num [1:67, 1:2] -70.2 -70.2 -70.2 -70.2 -70.2 ...
  .. ..- attr(*, "class")= chr [1:3] "XY" "POLYGON" "sfg"
  ..$ :List of 1
  .. ..$ : num [1:49, 1:2] -70.2 -70.2 -70.2 -70.2 -70.2 ...
  .. ..- attr(*, "class")= chr [1:3] "XY" "POLYGON" "sfg"
  ..$ :List of 1
  .. ..$ : num [1:35, 1:2] -70.2 -70.2 -70.2 -70.2 -70.2 ...
  .. ..- attr(*, "class")= chr [1:3] "XY" "POLYGON" "sfg"
  ..$ :List of 1
  .. ..$ : num [1:85, 1:2] -70.2 -70.2 -70.2 -70.2 -70.2 ...
  .. ..- attr(*, "class")= chr [1:3] "XY" "POLYGON" "sfg"
  ..$ :List of 1
  .. ..$ : num [1:27, 1:2] -70.2 -70.2 -70.2 -70.2 -70.2 ...
  .. ..- attr(*, "class")= chr [1:3] "XY" "POLYGON" "sfg"
  ..$ :List of 1
  .. ..$ : num [1:121, 1:2] -70.2 -70.2 -70.2 -70.2 -70.2 ...
  .. ..- attr(*, "class")= chr [1:3] "XY" "POLYGON" "sfg"
  .. [list output truncated]
  ..- attr(*, "class")= chr [1:2] "sfc_POLYGON" "sfc"
  ..- attr(*, "precision")= num 0
  ..- attr(*, "crs")=List of 2
  .. ..$ input: chr "WGS 84"
  .. ..$ wkt  : chr "GEOGCRS[\"WGS 84\",\n    DATUM[\"World Geodetic System 1984\",\n        ELLIPSOID[\"WGS 84\",6378137,298.257223"| __truncated__
  .. ..- attr(*, "class")= chr "crs"
  ..- attr(*, "bbox")= 'bbox' Named num [1:4] -70.2 43.6 -69.8 43.9
  .. ..- attr(*, "names")= chr [1:4] "xmin" "ymin" "xmax" "ymax"
  ..- attr(*, "n_empty")= int 0
 - attr(*, "sf_column")= chr "geometry"
 - attr(*, "agr")= Factor w/ 3 levels "constant","aggregate",..: NA NA NA NA NA NA
  ..- attr(*, "names")= chr [1:6] "year" "acres" "hectares" "cover" ...
R
# the years
unique(seagrass_casco$year)
OUTPUT
[1] 2022 2018 2013 2010 1997R
# the classes
unique(seagrass_casco$cover_pct)
OUTPUT
[1] "0% to 10%" "40% to 70%" "70% to 100%" "10% to 40%" "0%" R
#beds per year
seagrass_casco |>
  group_by(year) |>
  count()
ERROR
Error in `as_tibble()`:
! All columns in a tibble must be vectors.
✖ Column `geometry` is a `sfc_POLYGON/sfc` object.
What’s interesting about the last one, is that you can see that
summarizing actions in dplyr MERGE THE GEOMETRY within a
group. This can be useful at at times to have fewer rows to deal with
for the same geometry, or for other spatial operations.
Adding Inputs to the UI
Now that we have data, we need to give our user the tools to explore
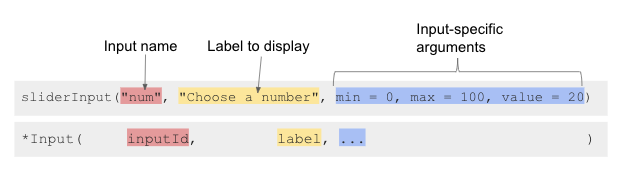
it. Shiny provides a wide variety of functions to create
Inputs. These functions all follow a similar naming
convention and structure. The function name will use camelCase with the
first part describing the input, and the second being the word “Input” -
such as selectInput(), sliderInput(), and
more.
The function then takes an inputID argument - a string
which will be used to refer to the input later on in the server. Then a
label argument, for what the user will see as the text
describing the input. Finally, a wide variety of input specific
arguments. For example, see the following from Dean
Attali’s tutorial.
 For the purposes of our app,
let’s begin by adding a
For the purposes of our app,
let’s begin by adding a selectInput() to allow a user to
choose a year.
Callout
It would have been nice to have a slider for year. But, base Shiny
doesn’t have a function for that. You’d need
sliderTextInput() from shinyWidgets.
Looking at ?selectInput we see we will need the
following arguments:
-
inputId- a name for our input -
label- what the user sees -
choices- some choices for years. This can just be theunique()years from our data. -
selected = NULL- an default first year. For the moment, we will set it to the first year in our data.
Let’s insert the following in our sidebarPanel(),
replacing the text that was there, and see what it produces.
R
selectInput(
  inputID = "year",
  label = "Choose a year:",
  choices = unique(seagrass_casco$year) |> sort(),
  selected = unique(seagrass_casco$year) |> min() #to get the earliest year
)
You will note that we are using the data to populate this form. This
is good practice so that you don’t enter a value into your select that
isn’t found in the data, which can cause havoc. We also used
sort() so that our selector was in order.
R
checkboxGroupInput(
  inputId = "cover",
  label = "Percent Cover Classes:",
  choices = unique(seagrass_casco$cover_pct) |> sort(),
  selected =  unique(seagrass_casco$cover_pct) |> sort()
)
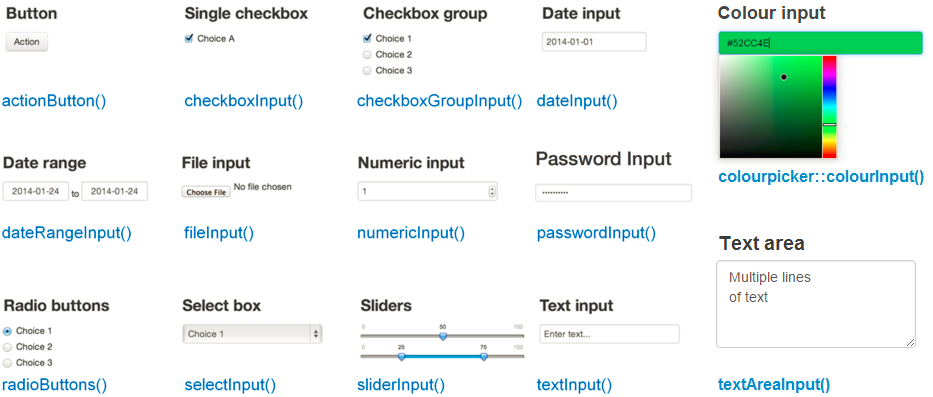
This is just the start of *Input() possibilities. Shiny
itself hosts a number of inputs, and there are multiple packages that
host other possible inputs.
Adding Placeholders for Outputs
Before we get to the business of creating outputs, we need to have
Shiny tell us where in the UI the outputs will be placed. To do this,
much like the *Input() functions, we have a series of
*Output() functions that will generate HTML placeholders
for where different outputs should go.
| Function | Output Type |
|---|---|
| plotOutput() | plot, ggplot |
| tableOutput() | table or data frame |
| uiOutput() | Shiny UI element |
| textOutput() | text |
| htmlOutput() | HTML code |
| leaflet::leafletOutput() | leaflet map |
Like inputs, these functions have a first argument - in this case
outputId which is a character string, and will be used
elsewhere in the app. Other arguemtns to these functions vary by output,
but can be used to do things like specify output window size, scaling,
and more. For the moment, let’s add two plotOutput()
windows to our app. One for a map - called “map” and one for a
histogram, called “hist”. This will go in our mainPanel()
as follows:
R
   mainPanel(
     plotOutput("map"),
     plotOutput("hist"),
   )
Note, if we had wanted to make these side by side, we could have used
column() or even gone hard on HTML with tables.
Render your app to make sure it works, but you will see that these areas will currently appear blank.
Servers and the Output
It is now time to dig into our server. Recall the code for the server looks like this:
R
# 3. define a server
server <- function(input, output) {}
It’s just an empty creation of a function. What happens inside the
function is what interests us. Note that the function takes two
arguments - input and output. These are the
names of lists that are part of the Shiny environment.
The list input stores all of the inputs from the
*Input() functions in the UI. The list output
will contain all of the outputs generated by functions in the server to
then plug into the UI above. All of the IDs we have in our
ui will be used as parts of these lists. So,
input$year will contain the value of year chosen.
output$map will contain the plot of a map to be displayed
in the UI.
So how do we generate output? Throughout our server we need to
continually add pieces to the output list that match what
is in the UI. These pieces should be generated by a series of
render*() functions. We have functions like
renderPlot(), renderTable(), etc. Note how
they are in many ways the inverse of the *Output()
functions above. render comes first - which is useful as it
reminds you that you are working in the server. But then the type of
output being generated has a direct match with a *Output()
function above. It makes it easy to search back and forth and to find
matching functions and elements.
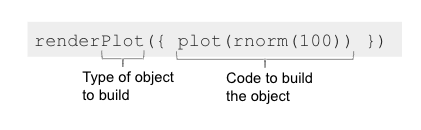 an
example render function from Dean Attali
an
example render function from Dean Attali
Note in the above function the argument to renderPlot()
is enclosed in {}. What? Curly braces? Why? Who? Don’t
worry. Think of them like fences to enclose a block of code. That block
of code is then passed to renderPlot() as a single
argument. The function knows how to handle and parse it. But, it only
wants one lump of code to work on. Formally, this argument is named
expr, but, that rarely gets used. As with all other
functions, render*() functions have other arguments that
can be supplied to fine-tune how they are executed.
Let’s modify our server to have sections for our outputs.
R
# 3. define a server
server <- function(input, output) {

  # our map block
  output$map <- renderPlot({

  })

  # our histogram block
  output$hist <- renderPlot({

  })


}
Now, in each block, we will need to filter our seagrass data down
based on input selection. This is going to require two
dplyr::filter() operations. The first to subset to year.
The second to subset to only those cover percent classes that are in the
cover percent selector. For both of these, we will reference our
input list - input$year and
input$cover. Let’s add that filter operation to both code
blocks.
R
# 3. define a server
server <- function(input, output) {

  # our map block
  output$map <- renderPlot({

    dat <- seagrass_casco |>
      filter(year == input$year) |>
      filter(cover_pct %in% input$cover)

  })

  # our histogram block
  output$hist <- renderPlot({

    dat <- seagrass_casco |>
      filter(year == input$year) |>
      filter(cover_pct %in% input$cover)
  })


}
Note, because these are two separate code blocks, we can reuse the
object name dat. In our next lesson, we will talk about how
to minimize copying and pasting code.
Finally, for each block, let’s add a ggplot(). In the
first, we will make a map based on geom_sf() with a good
polygon width and a viridis color scale. For the second, we will look at
the hectares of each bed.
R
# 3. define a server
server <- function(input, output) {

  # our map block
  output$map <- renderPlot({

    dat <- seagrass_casco |>
      filter(year == input$year) |>
      filter(cover_pct %in% input$cover)

    ggplot() +
      geom_sf(data = dat,
              linewidth = 1.5,
              color = "darkgreen")

  })

  # our histogram block
  output$hist <- renderPlot({

    dat <- seagrass_casco |>
      filter(year == input$year) |>
      filter(cover_pct %in% input$cover)

    ggplot(data = dat,
           aes(x = hectares)) +
      geom_histogram(bins = 50)
  })

}
Before you try and run this, remember to add
library(ggplot2) to your preamble.
ERROR
Error: package or namespace load failed for 'sf' in dyn.load(file, DLLpath = DLLpath, ...):
 unable to load shared object '/home/runner/.local/share/renv/cache/v5/R-4.3/x86_64-pc-linux-gnu/units/0.8-5/119d19da480e873f72241ff6962ffd83/units/libs/units.so':
  libudunits2.so.0: cannot open shared object file: No such file or directory
OUTPUT
Listening on http://127.0.0.1:3908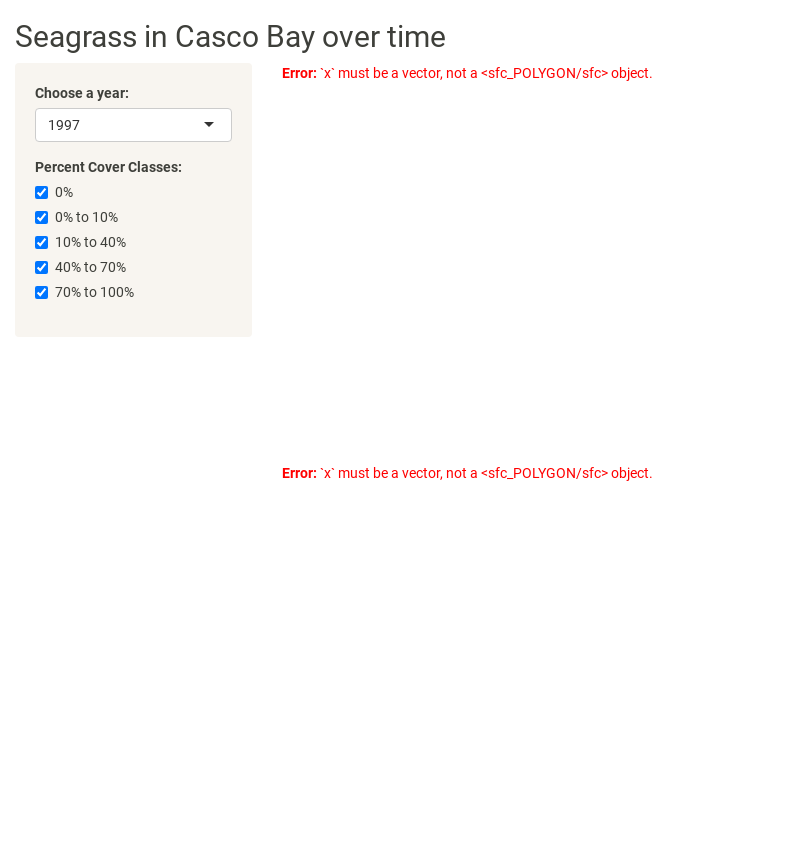
Oh No! Something Went Wrong with my Code!
As one last note, if you are running your code and it does not do
what you think it should do, the easiest way to begin the debugging
process is to see what objects you are working with in your
render*() calls. To do this, we can liberally sprinkle
print() statements in those calls. This will not return
text to the app, but rather will print to the console. So, if we put
print(input$year) in one of our render calls, whenever we
changed the year, it would print to the console. Later, when we upload
our app, we will see that it will print to the logfile for each run of
the app.
Key Points
- There are many types of inputs and outputs available for Shiny apps.
- Inputs follow a basic structure of having a
*Input()function with standard arguments in the UI. - Outputs have a placeholder in the UI using a
*Output()function. - Outputs are rendered in the server with a
render*()function. - The server has two lists to work with -
inputandoutput- which contain information for both.