Intro to Raster Data
Last updated on 2024-03-12 | Edit this page
OUTPUT
phantomjs has been installed to /home/runner/binWARNING
Warning in
download.file("https://www.naturalearthdata.com/http//www.naturalearthdata.com/download/110m/physical/ne_110m_graticules_all.zip",
: cannot open URL
'https://www.naturalearthdata.com/http//www.naturalearthdata.com/download/110m/physical/ne_110m_graticules_all.zip':
HTTP status was '500 Internal Server Error'
ERROR
Error in download.file("https://www.naturalearthdata.com/http//www.naturalearthdata.com/download/110m/physical/ne_110m_graticules_all.zip", : cannot open URL 'https://www.naturalearthdata.com/http//www.naturalearthdata.com/download/110m/physical/ne_110m_graticules_all.zip'Overview
Questions
- What is a raster dataset?
- How do I work with and plot raster data in R?
- How can I handle missing or bad data values for a raster?
Objectives
- Describe the fundamental attributes of a raster dataset.
- Explore raster attributes and metadata using R.
- Import rasters into R using the
terrapackage. - Plot a raster file in R using the
ggplot2package. - Describe the difference between single- and multi-band rasters.
Things You’ll Need To Complete This Episode
See the lesson homepage for detailed information about the software, data, and other prerequisites you will need to work through the examples in this episode.
In this episode, we will introduce the fundamental principles, packages and metadata/raster attributes that are needed to work with raster data in R. We will discuss some of the core metadata elements that we need to understand to work with rasters in R, including CRS and resolution. We will also explore missing and bad data values as stored in a raster and how R handles these elements.
We will continue to work with the dplyr and
ggplot2 packages that were introduced in the Introduction
to R for Geospatial Data lesson. We will use two additional packages
in this episode to work with raster data - the terra and
sf packages. Make sure that you have these packages
loaded.
R
library(terra)
library(ggplot2)
library(tidyterra)
library(dplyr)
Introduce the Data
If not already discussed, introduce the datasets that will be used in this lesson. A brief introduction to the datasets can be found on the Geospatial workshop homepage.
For more detailed information about the datasets, check out the Geospatial workshop data page.
View Raster File Attributes
We will be working with a series of GeoTIFF files in this lesson. The
GeoTIFF format contains a set of embedded tags with metadata about the
raster data. We can use the function describe() to get
information about our raster data before we read that data into R. It is
ideal to do this before importing your data.
R
describe("data/landsat_casco/b10_cropped/LC09_L2SP_011030_20230920_20230922_02_T1_ST_B10.TIF")
OUTPUT
 [1] "Driver: GTiff/GeoTIFF"
 [2] "Files: data/landsat_casco/b10_cropped/LC09_L2SP_011030_20230920_20230922_02_T1_ST_B10.TIF"
 [3] "Size is 1128, 1349"
 [4] "Coordinate System is:"
 [5] "PROJCRS[\"WGS 84 / UTM zone 19N\","
 [6] "    BASEGEOGCRS[\"WGS 84\","
 [7] "        DATUM[\"World Geodetic System 1984\","
 [8] "            ELLIPSOID[\"WGS 84\",6378137,298.257223563,"
 [9] "                LENGTHUNIT[\"metre\",1]]],"
[10] "        PRIMEM[\"Greenwich\",0,"
[11] "            ANGLEUNIT[\"degree\",0.0174532925199433]],"
[12] "        ID[\"EPSG\",4326]],"
[13] "    CONVERSION[\"UTM zone 19N\","
[14] "        METHOD[\"Transverse Mercator\","
[15] "            ID[\"EPSG\",9807]],"
[16] "        PARAMETER[\"Latitude of natural origin\",0,"
[17] "            ANGLEUNIT[\"degree\",0.0174532925199433],"
[18] "            ID[\"EPSG\",8801]],"
[19] "        PARAMETER[\"Longitude of natural origin\",-69,"
[20] "            ANGLEUNIT[\"degree\",0.0174532925199433],"
[21] "            ID[\"EPSG\",8802]],"
[22] "        PARAMETER[\"Scale factor at natural origin\",0.9996,"
[23] "            SCALEUNIT[\"unity\",1],"
[24] "            ID[\"EPSG\",8805]],"
[25] "        PARAMETER[\"False easting\",500000,"
[26] "            LENGTHUNIT[\"metre\",1],"
[27] "            ID[\"EPSG\",8806]],"
[28] "        PARAMETER[\"False northing\",0,"
[29] "            LENGTHUNIT[\"metre\",1],"
[30] "            ID[\"EPSG\",8807]]],"
[31] "    CS[Cartesian,2],"
[32] "        AXIS[\"(E)\",east,"
[33] "            ORDER[1],"
[34] "            LENGTHUNIT[\"metre\",1]],"
[35] "        AXIS[\"(N)\",north,"
[36] "            ORDER[2],"
[37] "            LENGTHUNIT[\"metre\",1]],"
[38] "    USAGE["
[39] "        SCOPE[\"Engineering survey, topographic mapping.\"],"
[40] "        AREA[\"Between 72°W and 66°W, northern hemisphere between equator and 84°N, onshore and offshore. Aruba. Bahamas. Brazil. Canada - New Brunswick (NB); Labrador; Nunavut; Nova Scotia (NS); Quebec. Colombia. Dominican Republic. Greenland. Netherlands Antilles. Puerto Rico. Turks and Caicos Islands. United States. Venezuela.\"],"
[41] "        BBOX[0,-72,84,-66]],"
[42] "    ID[\"EPSG\",32619]]"
[43] "Data axis to CRS axis mapping: 1,2"
[44] "Origin = (398865.000000000000000,4866405.000000000000000)"
[45] "Pixel Size = (30.000000000000000,-30.000000000000000)"
[46] "Metadata:"
[47] "  AREA_OR_POINT=Area"
[48] "Image Structure Metadata:"
[49] "  COMPRESSION=LZW"
[50] "  INTERLEAVE=BAND"
[51] "Corner Coordinates:"
[52] "Upper Left  (  398865.000, 4866405.000) ( 70d15'36.90\"W, 43d56'37.75\"N)"
[53] "Lower Left  (  398865.000, 4825935.000) ( 70d15' 9.45\"W, 43d34'46.27\"N)"
[54] "Upper Right (  432705.000, 4866405.000) ( 69d50'19.04\"W, 43d56'51.69\"N)"
[55] "Lower Right (  432705.000, 4825935.000) ( 69d50' 0.77\"W, 43d35' 0.04\"N)"
[56] "Center      (  415785.000, 4846170.000) ( 70d 2'46.52\"W, 43d45'49.65\"N)"
[57] "Band 1 Block=1128x1 Type=Float32, ColorInterp=Gray"
[58] "  Description = SST_F_20230920"
[59] "  Min=47.097 Max=80.462 "
[60] "  Minimum=47.097, Maximum=80.462, Mean=-9999.000, StdDev=-9999.000"
[61] "  NoData Value=nan"
[62] "  Metadata:"
[63] "    STATISTICS_MAXIMUM=80.461517333984"
[64] "    STATISTICS_MEAN=-9999"
[65] "    STATISTICS_MINIMUM=47.096858978271"
[66] "    STATISTICS_STDDEV=-9999"
If you wish to store this information in R, you can do the following:
R
casco_b10_2023_info <- capture.output(
  describe("data/landsat_casco/b10_cropped/LC09_L2SP_011030_20230920_20230922_02_T1_ST_B10.TIF")
)
Each line of text that was printed to the console is now stored as an
element of the character vector casco_b10_2023_info. We
will be exploring this data throughout this episode. By the end of this
episode, you will be able to explain and understand the output
above.
Open a Raster in R
Now that we’ve previewed the metadata for our GeoTIFF, let’s import
this raster dataset into R and explore its metadata more closely. We can
use the rast() function to open a raster in R.
First we will load our raster file into R and view the data structure.
R
b10_casco_2023 <-
  rast("data/landsat_casco/b10_cropped/LC09_L2SP_011030_20230920_20230922_02_T1_ST_B10.TIF")

b10_casco_2023
OUTPUT
class       : SpatRaster
dimensions  : 1349, 1128, 1  (nrow, ncol, nlyr)
resolution  : 30, 30  (x, y)
extent      : 398865, 432705, 4825935, 4866405  (xmin, xmax, ymin, ymax)
coord. ref. : WGS 84 / UTM zone 19N (EPSG:32619)
source      : LC09_L2SP_011030_20230920_20230922_02_T1_ST_B10.TIF
name        : SST_F_20230920
min value   :       47.09686
max value   :       80.46152
The information above includes a report of min and max values, but no other data range statistics. Similar to other R data structures like vectors and data frame columns, descriptive statistics for raster data can be retrieved like
R
summary(b10_casco_2023)
WARNING
Warning: [summary] used a sampleOUTPUT
 SST_F_20230920
 Min.   :47.13
 1st Qu.:60.04
 Median :60.57
 Mean   :60.97
 3rd Qu.:61.63
 Max.   :80.35
 NA's   :50545
but note the warning - unless you force R to calculate these
statistics using every cell in the raster, it will take a random sample
of 100,000 cells and calculate from that instead. To force calculation
all the values, you can use the function values:
R
summary(values(b10_casco_2023))
OUTPUT
 SST_F_20230920
 Min.   :47.1
 1st Qu.:60.0
 Median :60.6
 Mean   :61.0
 3rd Qu.:61.6
 Max.   :80.5
 NA's   :766560
To visualise this data in R using ggplot2, we have two
options. First, We can convert it to a dataframe. We learned about
dataframes in an
earlier lesson. The terra package has an built-in
function for conversion to a plotable dataframe.
R
b10_casco_2023_df <- as.data.frame(b10_casco_2023, xy = TRUE)
Now when we view the structure of our data, we will see a standard dataframe format.
R
str(b10_casco_2023_df)
OUTPUT
'data.frame':	755112 obs. of  3 variables:
 $ x             : num  428640 428670 428700 428730 428760 ...
 $ y             : num  4866390 4866390 4866390 4866390 4866390 ...
 $ SST_F_20230920: num  67.1 66.9 66.7 66.6 66.5 ...
We can use ggplot() to plot this data. We will set the
color scale to scale_fill_viridis_c which is a
color-blindness friendly color scale. We will also use the
coord_quickmap() function to use an approximate Mercator
projection for our plots. This approximation is suitable for small areas
that are not too close to the poles. Other coordinate systems are
available in ggplot2 if needed, you can learn about them at their help
page ?coord_map.
R
ggplot() +
    geom_raster(data = b10_casco_2023_df,
                aes(x = x, y = y,
                    fill = SST_F_20230920)) +
    scale_fill_viridis_c() +
    coord_quickmap()
WARNING
Warning: Raster pixels are placed at uneven horizontal intervals and will be shifted
ℹ Consider using `geom_tile()` instead.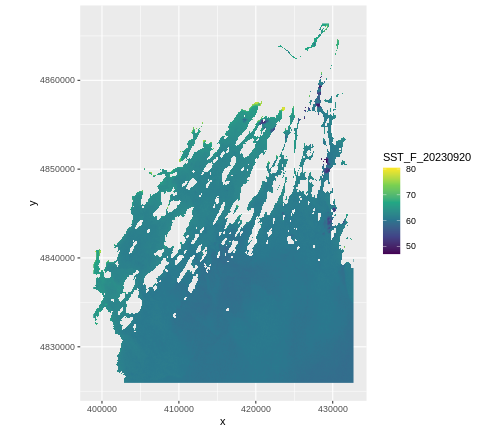
This is somewhat tedious. With the tidyterra package we
have another geom - geom_spatraster that deals with rasters
loaded by terra. Also, as land is NA in this data, it will
plot it quite nicely by default. We’ll also use
coord_sf()
R
ggplot() +
    geom_spatraster(data = b10_casco_2023,
                    aes(fill = SST_F_20230920)) +
    scale_fill_viridis_c()
OUTPUT
<SpatRaster> resampled to 500778 cells for plotting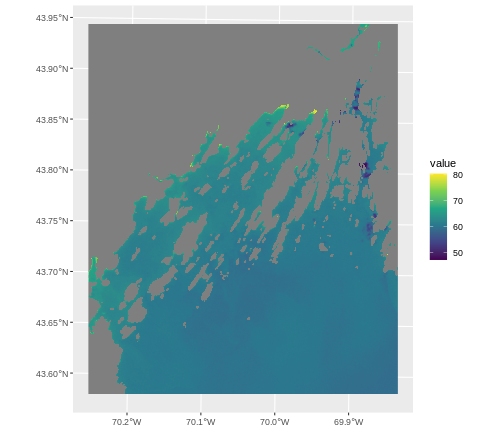
This looks great, and is now on the lat/long scale: CRS 4326. That’s
because spatial data is always plotted using the coord_sf()
coordinate system which defaults to 4326. If we want to show things in
another projection, or use the original one, we have to set a
datum argument.
R
ggplot() +
    geom_spatraster(data = b10_casco_2023,
                    aes(fill = SST_F_20230920)) +
    scale_fill_viridis_c() +
  coord_sf(datum = crs(b10_casco_2023, proj = TRUE))
OUTPUT
<SpatRaster> resampled to 500778 cells for plotting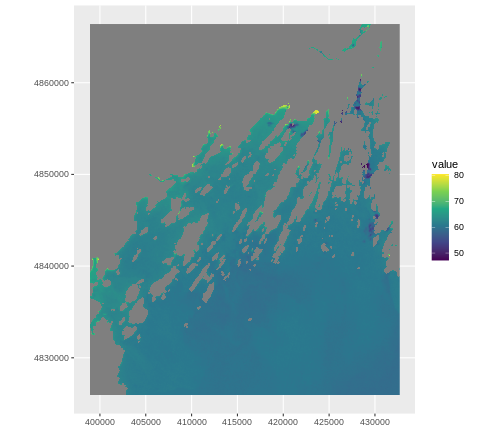
Plotting Tip
More information about the Viridis palette used above at R Viridis package documentation.
See ?plot for more arguments to customize the plot
R
plot(b10_casco_2023)
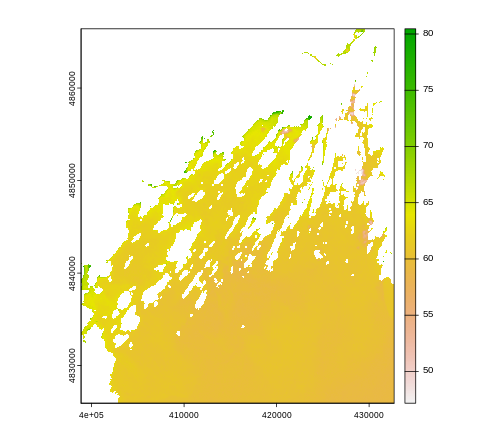
This map shows the sea surface temperature of our Casco Bay at one point in time in 2023. We can see that the maximum temperature is 80. While intuitively we know this is Farenheit (80C would be…. something), we don’t know for sure. We can look at the metadata of our object to see what the units are. Much of the metadata that we’re interested in is part of the CRS. We introduced the concept of a CRS in an earlier lesson.
Now we will see how features of the CRS appear in our data file and what meanings they have.
Understanding CRS in Proj4 Format
The CRS for our data is given to us by R in proj4
format. Let’s break down the pieces of proj4 string. The
string contains all of the individual CRS elements that R or another GIS
might need. Each element is specified with a + sign,
similar to how a .csv file is delimited or broken up by a
,. After each + we see the CRS element being
defined. For example projection (proj=) and datum
(datum=).
UTM Proj4 String
A projection string (like the one of b10_casco_2023)
specifies the UTM projection as follows:
+proj=utm +zone=19 +datum=WGS84 +units=m +no_defs
- proj=utm: the projection is UTM, UTM has several zones.
- zone=19: the zone is 19
- datum=WGS84: the datum is WGS84 (the datum refers to the 0,0 reference for the coordinate system used in the projection)
- units=m: the units for the coordinates are in meters
Note that the zone is unique to the UTM projection. Not all CRSs will have a zone. Image source: Chrismurf at English Wikipedia, via Wikimedia Commons (CC-BY).

Calculate Raster Min and Max Values
It is useful to know the minimum or maximum values of a raster dataset. In this case, given we are working with temperature data, these values represent the min/max sea surface temperature range in Casco Bay.
Raster statistics are often calculated and embedded in a GeoTIFF for us. We can view these values:
R
minmax(b10_casco_2023)
OUTPUT
    SST_F_20230920
min       47.09686
max       80.46152
R
min(values(b10_casco_2023), na.rm = TRUE)
OUTPUT
[1] 47.09686R
max(values(b10_casco_2023), na.rm = TRUE)
OUTPUT
[1] 80.46152We can see that the temperature at our site ranges from ~47F to ~80F.
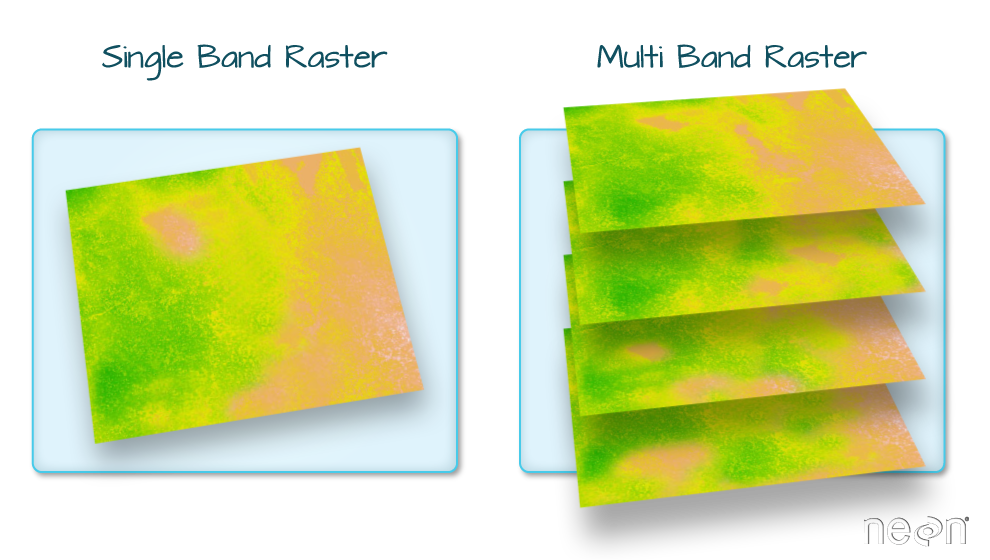
Raster Bands
The Sea Surface Temperature object (b10_casco_2023) that
we’ve been working with is a single band raster. This means that there
is only one data set stored in the raster: SST at one time point.
A raster dataset can contain one or more bands. We can use the
rast() function to import one single band from a single or
multi-band raster. We can view the number of bands in a raster using the
nlyr() function.
R
nlyr(b10_casco_2023)
OUTPUT
[1] 1However, raster data can also be multi-band, meaning that one raster
file contains data for more than one variable or time period for each
cell. By default the raster() function only imports the
first band in a raster regardless of whether it has one or more bands.
Jump to a later episode in this series for information on working with
multi-band rasters: Work with
Multi-band Rasters in R.
Bad Data Values in Rasters
Sometimes your rasters can have bad data values. These are different
from NoData Values, which get represented by NAs. Bad data
values are values that fall outside of the applicable range of a
dataset.
Examples of Bad Data Values:
- The normalized difference vegetation index (NDVI), which is a measure of greenness, has a valid range of -1 to 1. Any value outside of that range would be considered a “bad” or miscalculated value.
- Reflectance data in an image will often range from 0-1 or 0-10,000
depending upon how the data are scaled. Thus a value greater than 1 or
greater than 10,000 is likely caused by an error in either data
collection or processing.
- Coastal ocean data could be contaminated by measurements from land.
Find Bad Data Values
Sometimes a raster’s metadata will tell us the range of expected values for a raster. Values outside of this range are suspect and we need to consider that when we analyze the data. Sometimes, we need to use some common sense and scientific insight as we examine the data - just as we would for field data to identify questionable values.
Plotting data with appropriate highlighting can help reveal patterns in bad values and may suggest a solution. For example, let’s look at the range of our SST raster.
R
minmax(b10_casco_2023)
OUTPUT
    SST_F_20230920
min       47.09686
max       80.46152
47F seems reasonable, but 80? Maybe it is. But maybe it’s just land
values that bled over. Let’s assume 75F is the real maximum. To view
where we might have bad data, we can use classify() which
takes a matrix with three columns. The first is a low value. The second
is a high value. And the third is how we want that classified. Let’s say
we wanted to look at bad values in our SST dataset.
R
# reclassify raster to ok/not ok
range_matrix <- matrix(c(
  40,75, 1, #low, high, make a 1
  75, 90, 2
), ncol = 3, byrow = TRUE)

b10_highvals <- classify(b10_casco_2023,
                         rcl = range_matrix)

plot(b10_highvals)
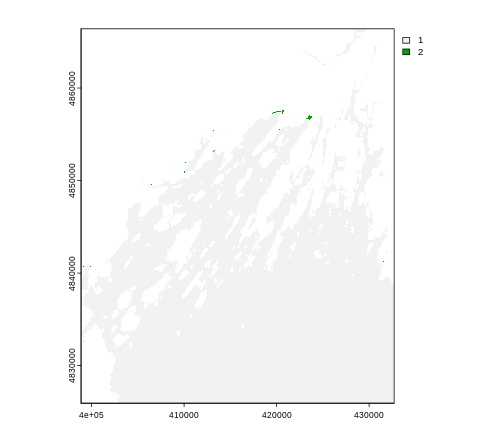
Yeah, it’s some spots at the tail-end of the coast that could indeed
by pixels contaminated by land. To fix that, we can set values outside
of our range to NA using clamp()
R
b10_casco_2023 <- clamp(b10_casco_2023,
                        lower = 40,
                        upper = 75)

minmax(b10_casco_2023)
OUTPUT
    SST_F_20230920
min       47.09686
max       75.00000
Create A Histogram of Raster Values
We can explore the distribution of values contained within our raster
using the geom_histogram() function which produces a
histogram. Histograms are often useful in identifying outliers and bad
data values in our raster data.
R
ggplot() +
    geom_histogram(data = b10_casco_2023_df,
                   mapping = aes(x = SST_F_20230920))
OUTPUT
`stat_bin()` using `bins = 30`. Pick better value with `binwidth`.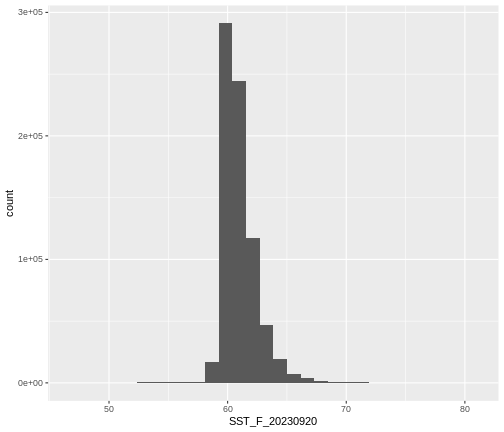
Notice that a warning message is thrown when R creates the histogram.
stat_bin() using bins = 30. Pick better
value with binwidth.
This warning is caused by a default setting in
geom_histogram enforcing that there are 30 bins for the
data. We can define the number of bins we want in the histogram by using
the bins value in the geom_histogram()
function.
R
ggplot() +
    geom_histogram(data = b10_casco_2023_df,
                   mapping = aes(x = SST_F_20230920),
                   bins = 100)
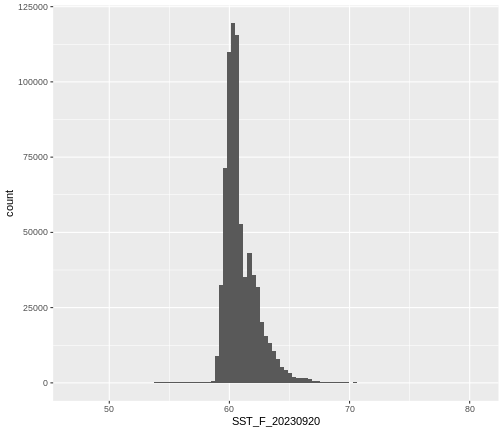
Note that the shape of this histogram looks similar to the previous one that was created using the default of 30 bins. The distribution of SST values looks reasonable. Although, we can see some very thin tails that we might want to inspect to see if they are real values or bad data.
Challenge: Explore Raster Metadata
Use describe() to determine the following about the
data/landsat_casco/b10_cropped/LC08_L2SP_011030_20130815_20200912_02_T1_ST_B10.TIF
file:
- Does this file have the same CRS as
b10_casco_2023_df? - What is the
NoData Value? - What is resolution of the raster data?
- How large would a 5x5 pixel area be on the Earth’s surface?
- Is the file a multi- or single-band raster?
R
describe("data/landsat_casco/b10_cropped/LC08_L2SP_011030_20130815_20200912_02_T1_ST_B10.TIF")
OUTPUT
 [1] "Driver: GTiff/GeoTIFF"
 [2] "Files: data/landsat_casco/b10_cropped/LC08_L2SP_011030_20130815_20200912_02_T1_ST_B10.TIF"
 [3] "Size is 1128, 1349"
 [4] "Coordinate System is:"
 [5] "PROJCRS[\"WGS 84 / UTM zone 19N\","
 [6] "    BASEGEOGCRS[\"WGS 84\","
 [7] "        DATUM[\"World Geodetic System 1984\","
 [8] "            ELLIPSOID[\"WGS 84\",6378137,298.257223563,"
 [9] "                LENGTHUNIT[\"metre\",1]]],"
[10] "        PRIMEM[\"Greenwich\",0,"
[11] "            ANGLEUNIT[\"degree\",0.0174532925199433]],"
[12] "        ID[\"EPSG\",4326]],"
[13] "    CONVERSION[\"UTM zone 19N\","
[14] "        METHOD[\"Transverse Mercator\","
[15] "            ID[\"EPSG\",9807]],"
[16] "        PARAMETER[\"Latitude of natural origin\",0,"
[17] "            ANGLEUNIT[\"degree\",0.0174532925199433],"
[18] "            ID[\"EPSG\",8801]],"
[19] "        PARAMETER[\"Longitude of natural origin\",-69,"
[20] "            ANGLEUNIT[\"degree\",0.0174532925199433],"
[21] "            ID[\"EPSG\",8802]],"
[22] "        PARAMETER[\"Scale factor at natural origin\",0.9996,"
[23] "            SCALEUNIT[\"unity\",1],"
[24] "            ID[\"EPSG\",8805]],"
[25] "        PARAMETER[\"False easting\",500000,"
[26] "            LENGTHUNIT[\"metre\",1],"
[27] "            ID[\"EPSG\",8806]],"
[28] "        PARAMETER[\"False northing\",0,"
[29] "            LENGTHUNIT[\"metre\",1],"
[30] "            ID[\"EPSG\",8807]]],"
[31] "    CS[Cartesian,2],"
[32] "        AXIS[\"(E)\",east,"
[33] "            ORDER[1],"
[34] "            LENGTHUNIT[\"metre\",1]],"
[35] "        AXIS[\"(N)\",north,"
[36] "            ORDER[2],"
[37] "            LENGTHUNIT[\"metre\",1]],"
[38] "    USAGE["
[39] "        SCOPE[\"Engineering survey, topographic mapping.\"],"
[40] "        AREA[\"Between 72°W and 66°W, northern hemisphere between equator and 84°N, onshore and offshore. Aruba. Bahamas. Brazil. Canada - New Brunswick (NB); Labrador; Nunavut; Nova Scotia (NS); Quebec. Colombia. Dominican Republic. Greenland. Netherlands Antilles. Puerto Rico. Turks and Caicos Islands. United States. Venezuela.\"],"
[41] "        BBOX[0,-72,84,-66]],"
[42] "    ID[\"EPSG\",32619]]"
[43] "Data axis to CRS axis mapping: 1,2"
[44] "Origin = (398865.000000000000000,4866405.000000000000000)"
[45] "Pixel Size = (30.000000000000000,-30.000000000000000)"
[46] "Metadata:"
[47] "  AREA_OR_POINT=Area"
[48] "Image Structure Metadata:"
[49] "  COMPRESSION=LZW"
[50] "  INTERLEAVE=BAND"
[51] "Corner Coordinates:"
[52] "Upper Left  (  398865.000, 4866405.000) ( 70d15'36.90\"W, 43d56'37.75\"N)"
[53] "Lower Left  (  398865.000, 4825935.000) ( 70d15' 9.45\"W, 43d34'46.27\"N)"
[54] "Upper Right (  432705.000, 4866405.000) ( 69d50'19.04\"W, 43d56'51.69\"N)"
[55] "Lower Right (  432705.000, 4825935.000) ( 69d50' 0.77\"W, 43d35' 0.04\"N)"
[56] "Center      (  415785.000, 4846170.000) ( 70d 2'46.52\"W, 43d45'49.65\"N)"
[57] "Band 1 Block=1128x1 Type=Float32, ColorInterp=Gray"
[58] "  Description = SST_F_20130815"
[59] "  Min=51.010 Max=89.659 "
[60] "  Minimum=51.010, Maximum=89.659, Mean=-9999.000, StdDev=-9999.000"
[61] "  NoData Value=nan"
[62] "  Metadata:"
[63] "    STATISTICS_MAXIMUM=89.659408569336"
[64] "    STATISTICS_MEAN=-9999"
[65] "    STATISTICS_MINIMUM=51.00980758667"
[66] " STATISTICS_STDDEV=-9999" - If this file has the same CRS as DSM_HARV? Yes: UTM Zone 19, WGS84, meters.
- What format
NoData Valuestake? 0 - The resolution of the raster data? 1x1
- How large a 5x5 pixel area would be? 5mx5m How? We are given resolution of 1x1 and units in meters, therefore resolution of 5x5 means 5x5m.
- Is the file a multi- or single-band raster? Single.